C10 · Food and Beverage · Global
Food price index month-on-month growth rate (monthly)
Global: 1.9% in August 2026, +1.3 pp on July 2026.
- 1.9% Latest · Global · August 2026
- +1.3 pp vs July 2026
- Monthly Release cadence
- 6 Records · 1 region · 2026
Verified 26 Sep 2026 · 1 publisher · Next period September 2026
Over time
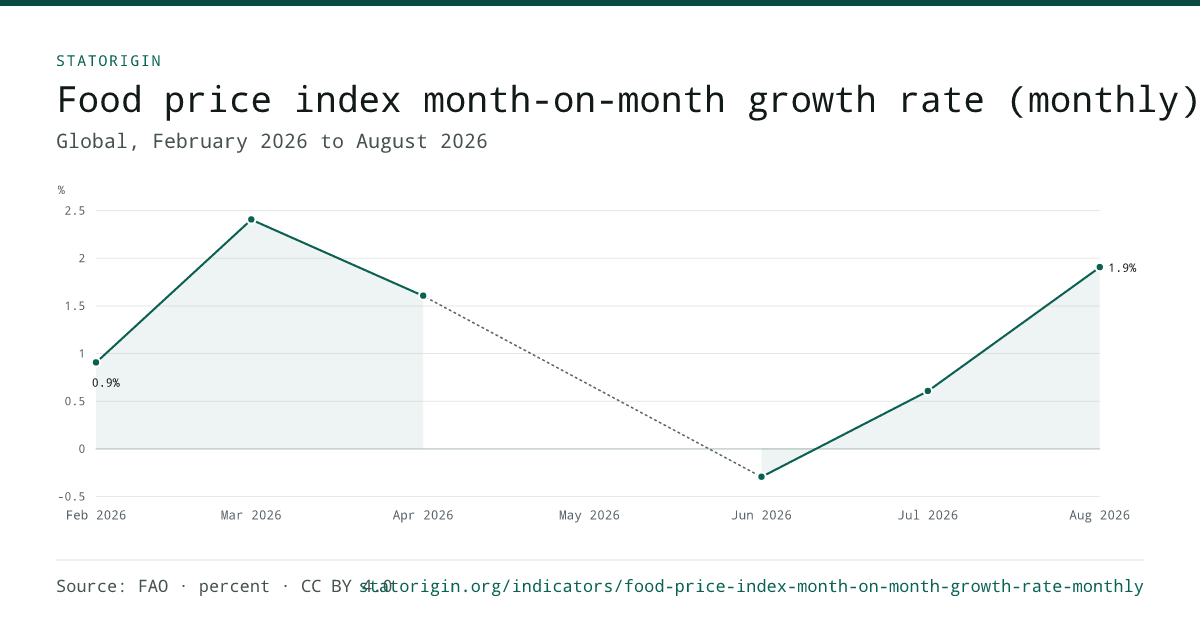
Global over time. Forecasts are dashed with hollow markers; the underlying values are one click away under the chart.
Food price index month-on-month growth rate (monthly)
Global, February 2026 to August 2026
No figure published for these periods
View the underlying data
| Period | Type | Value |
|---|---|---|
| February 2026 | Actual | 0.9% |
| March 2026 | Actual | 2.4% |
| April 2026 | Actual | 1.6% |
| June 2026 | Actual | -0.3% |
| July 2026 | Actual | 0.6% |
| August 2026 | Actual | 1.9% |
Every record
6 records · 1 region · 2026. Each period links to its record: the value, the quote it was read from, and the document.
| Period | Value | Source | Type |
|---|---|---|---|
| Global 6 records | |||
| August 2026 | 1.9% | FAO · 31 Aug 2026 | |
| July 2026 | 0.6% | FAO · 31 Jul 2026 | |
| June 2026 | -0.3% | FAO · 30 Jun 2026 | |
| April 2026 | 1.6% | FAO · 30 Apr 2026 | |
| March 2026 | 2.4% | FAO · 31 Mar 2026 | |
| February 2026 | 0.9% | FAO · 28 Feb 2026 | |
Download this data
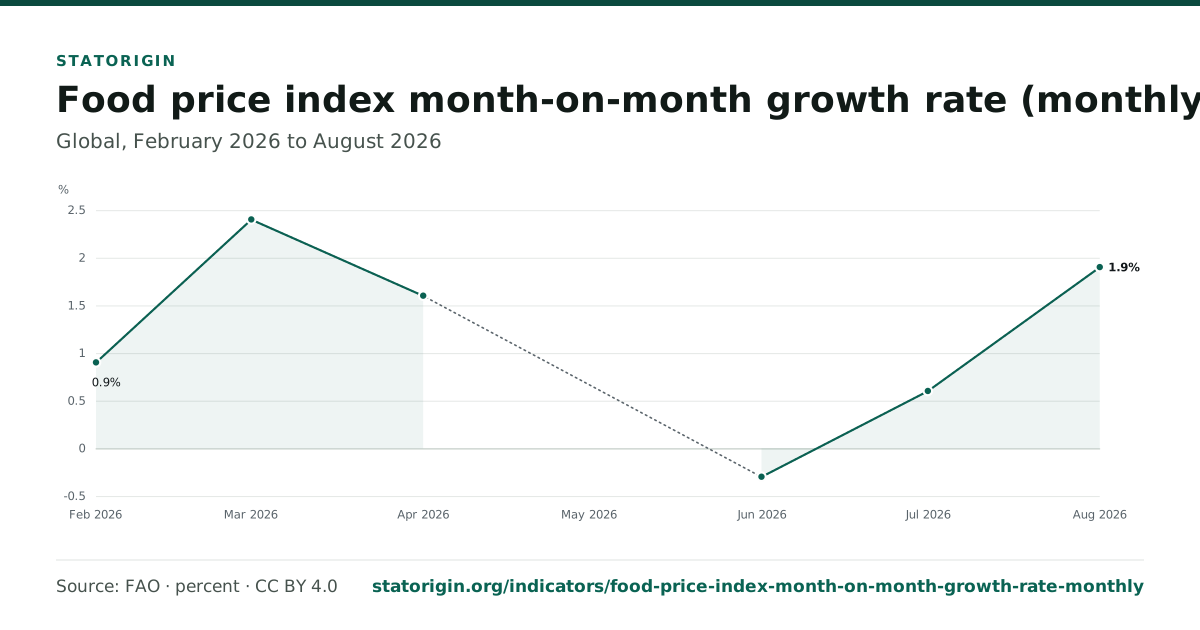
Every file carries its provenance: the CSV has a source column per row, and the chart images print the publisher, the licence and this page's address under the drawing. Source: FAO. Licence: CC BY 4.0.
Embed this chart
Free to embed anywhere, including commercially. The attribution bar is part of the chart.
Use and publication rights
- View, cite and link: free
Quote any number, cite this page or a single record, and link to it anywhere.
- Copy, chart and republish: free with attribution
The data is published under CC BY 4.0, commercial use included. Credit StatOrigin and the original publisher (FAO); the chart files already carry that line.
- The source documents: the publisher's terms
Figures are facts read from the publishers' own documents. The documents themselves, their text and design, stay under each publisher's terms; follow the source links for those.
How this measure is built
- Definition
- Percentage change in the international food price index compared to the previous month.
- Measure
- One slice of Food price index ( counting rule: month on month, form: growth ) . A measure of the monthly change in international prices of a basket of food commodities. Region and period are columns on every record, not slices.
- Limitations
- Values are shown as published; StatOrigin does not revise, fill gaps or convert currencies.
- Verification
- Each value, unit, period and place was checked against its quote before publication. See the methodology and the corrections process.
Sources · 6 documents
Other slices of food price index
- Food price index 9
- Food price index year-on-year growth rate (monthly) 7 year on year
- Food price index two-month growth rate 2 two month period
- Consumer food price inflation rate 1 consumer
- Food Price Index, change from peak 1 change from peak
- Food Price Index, month-over-month change 1 month over month
- Food Price Index, percentage change from peak 1 change from peak
- Food Price Index, year-over-year change 1 year over year
- Food commodity price index growth 1 world bank · year on year
- Food price index growth rate (monthly) 1
- World Bank food price index, month-on-month change 1 world bank · month on month
Frequently asked questions
What is the latest food price index month-on-month growth rate (monthly)?
Global: 1.9% in August 2026, +1.3 pp on July 2026.
Where does this data come from?
From 6 documents published by FAO. Every figure on this page links to its record, which quotes the sentence or table row the number was read from.
How often is it updated?
Monthly. The newest published period is August 2026; the next release should cover September 2026. A new figure appears here once the publisher releases it and it passes verification.
Can I use this data?
Yes. StatOrigin publishes it under CC BY 4.0: you may copy, chart and republish it, including commercially, with attribution to StatOrigin and to the original publisher.
Cite this page
Cite the page as a data set, or open any record to cite one figure: each record carries APA, MLA, Chicago and BibTeX forms that credit the original publisher.
StatOrigin. (2026). Food price index month-on-month growth rate (monthly) [Data set]. Retrieved September 29, 2026, from https://statorigin.org/indicators/food-price-index-month-on-month-growth-rate-monthly
"Food price index month-on-month growth rate (monthly)." StatOrigin, 2026, https://statorigin.org/indicators/food-price-index-month-on-month-growth-rate-monthly. Accessed 29 Sep. 2026.
StatOrigin. "Food price index month-on-month growth rate (monthly)." Data set, 2026. Accessed September 29, 2026. https://statorigin.org/indicators/food-price-index-month-on-month-growth-rate-monthly.
@misc{statorigin_food_price_index_month_on_month_growth_rate_monthly_2026, title = {Food price index month-on-month growth rate (monthly)}, author = {{StatOrigin}}, year = {2026}, url = {https://statorigin.org/indicators/food-price-index-month-on-month-growth-rate-monthly}, note = {Data set. Accessed 2026-09-29} }