D35 · Electricity and Gas Utilities · 68 measures · 12 regions

Power capacity additions

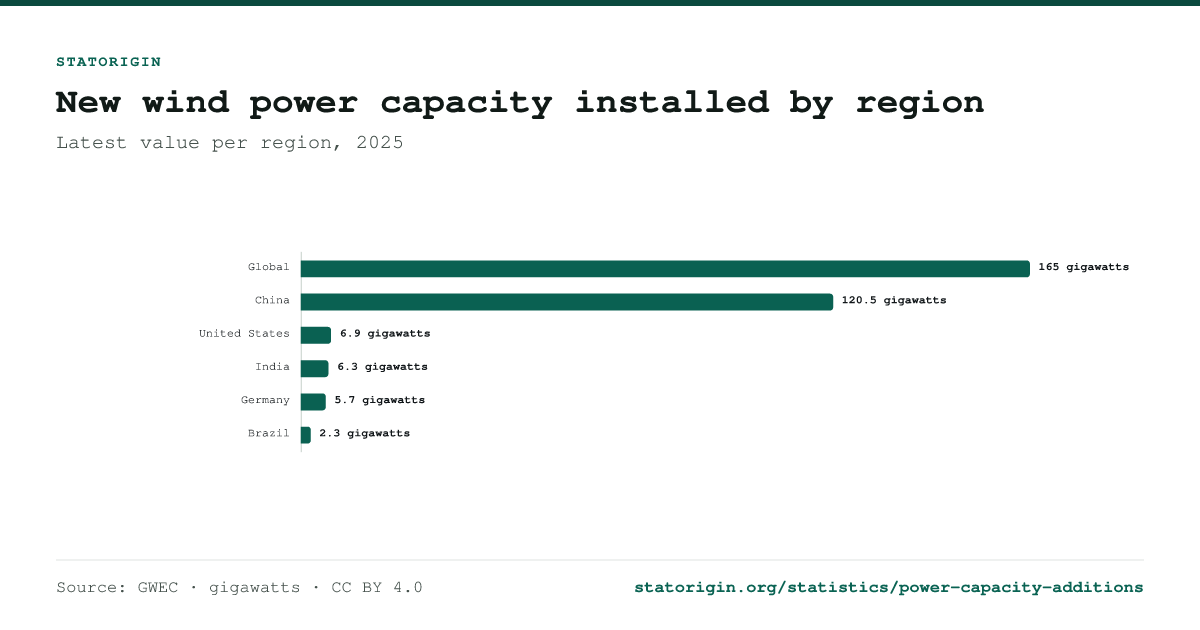
China had the highest new wind power capacity installed in 2025, at 120.5 gigawatts, ahead of United States (6.9 gigawatts) and India (6.3 gigawatts). Global: 165 gigawatts in 2025.

  • 165 gigawatts New wind power capacity installed · Global · 2025
  • 68Measures
  • 5Countries · 2016–2026

Verified 27 Sep 2026 · 4 publishers · 89 records · Next period 2026
CSV JSON PNG

New wind power capacity installed

The best-covered measure of power capacity additions. Every point opens its record; the values are one click away under the chart.

Fig 1 · D35 · New wind power capacity installed Annual

New wind power capacity installed by region

Latest value per region, 2025

6 entries
New wind power capacity installed by regionNew wind power capacity installed by region. 6 categories, highest is Global at 165 gigawatts. Brazil Germany India United States China Global 2.3 gigawatts 5.7 gigawatts 6.3 gigawatts 6.9 gigawatts 120.5 gigawatts 165 gigawatts
View the underlying data
New wind power capacity installed by region
Category Source Type Value
Global GWEC Actual 165 gigawatts
China GWEC Actual 120.5 gigawatts
United States GWEC Actual 6.9 gigawatts
India GWEC Actual 6.3 gigawatts
Germany GWEC Actual 5.7 gigawatts
Brazil GWEC Actual 2.3 gigawatts
Source: GWEC · gigawatts · CC BY 4.0 · statorigin.org
Embed

Free to embed, including commercially. The attribution bar is part of the chart; it is what keeps the data citable.

<iframe src="https://statorigin.org/embed/utilities--new-wind-power-capacity-installed--by-region" width="100%" height="380" style="border:1px solid #e2e5e3;border-radius:8px" title="New wind power capacity installed by region" loading="lazy"></iframe>
<p><a href="https://statorigin.org/statistics/power-capacity-additions">New wind power capacity installed by region</a>, data from StatOrigin, CC BY 4.0</p>
Preview embed

Every measure of power capacity additions

68 measures: the same subject cut by product, segment, basis or form. Each has its own page with every record.

Measure Latest Where and when Records
New wind power capacity installed 165 gigawatts Global, 2025 6
Chinese overseas wind installations share by destination region 57% Asia-Pacific, 2025 5
Planned battery storage capacity additions 14 gigawatts United States, 2028 (forecast) 4
Accelerated case renewable capacity growth boost 30% Global, 2017–2022 (forecast) 2
New hydropower capacity added 4.5 GW Africa, 2024 2
New pumped storage hydropower capacity added 8.4 GW Global, 2024 2
Solar PV and wind share of renewable capacity growth 80% Global, 2017–2022 (forecast) 2
Wind and solar PV capacity additions growth rate 30% China, 2020 (forecast) 2
Wind turbine capacity installed 178 GW Global, 2025 2
Share of renewable capacity expansion driven by competitive auctions 20% Global, 2016 2
Solar PV share of renewable capacity growth 80% Global, 2024–2030 (forecast) 2
Utility-scale battery storage capacity additions 20.8 GW United States, 2023–2025 (forecast) 2
Accelerated case additional renewable capacity 1,150 gigawatts Global, 2017–2022 (forecast) 1
Accelerated case renewable capacity growth premium 26% Global, 2019–2024 (forecast) 1
Annual renewable capacity additions forecast for 2030 940 billion watts Global, 2030 (forecast) 1
Annual solar capacity additions 425 GW Global, 2023 1
Auctioned renewable capacity growth rate 15% Global, January–October 2020 1
Auctions and green certificate schemes coverage of capacity expansion 60% Global, 2021–2025 (forecast) 1
Battery storage capacity added 8.3 gigawatts United States, January–June 2026 1
Conventional hydropower capacity commissioned 4 GW Africa, 2025 1
Country share of global renewable capacity expansion 40% China, 2019–2024 (forecast) 1
Forecast average annual new wind power capacity 194 gigawatts Global, 2026–2030 (forecast) 1
Forecast compound annual growth rate of new wind capacity 5.2% Global, 2026–2030 (forecast) 1
Forecast increase in annual renewable capacity additions versus prior record year 70% Global, 2030 (forecast) 1
Forecast new wind power capacity to be commissioned 969 gigawatts Global, 2026–2030 (forecast) 1
Growth rate of new wind power capacity added 40% Global, 2025 1
Hydrogen's share of renewable capacity expansion by 2030 1% Global, 2024–2030 (forecast) 1
Hydropower capacity commissioned 28 GW Global, 2025 1
Hydropower share of renewable capacity growth 10% Global, 2019–2024 (forecast) 1
IEA renewable capacity additions forecast revision 18% Global, 2020 1
New conventional hydropower capacity added 4 billion watts Africa, 2025 1
New conventional hydropower capacity added (GW) 16.2 GW Global, 2024 1
New renewable capacity additions 560 GW Global, 2023 1
New renewable capacity additions forecast to 2030 (main case) 5,500 billion watts Global, 2024–2030 (forecast) 1
New renewable capacity driven by hydrogen demand by 2030 43 billion watts Global, 2024–2030 (forecast) 1
New solar PV capacity additions 74 gigawatts Global, 2016 1
Offshore wind share of renewable capacity growth 4% Global, 2019–2024 (forecast) 1
Offshore wind share of wind annual market 20% Global, 2025 (forecast) 1
Onshore wind capacity additions growth rate -15% Global, 2022 (forecast) 1
Onshore wind share of renewable capacity growth 25% Global, 2019–2024 (forecast) 1
Planned utility-scale battery storage capacity additions 54 GW United States, 2026–2028 (forecast) 1
Pumped storage capacity commissioned 7,500 MW China, 2025 1
Pumped storage capacity commissioned (GW) 11.6 GW Global, 2025 1
Renewable capacity additions 165 gigawatts Global, 2016 1
Renewable capacity additions (watts) 560 billion watts Global, 2023 1
Renewable capacity additions growth rate 10% Global, 2021 (forecast) 1
Renewables share of global power capacity additions 66.7% Global, 2018–2040 (forecast) 1
Renewables share of net new power capacity 66.7% Global, 2016 1
Renewables share of net power capacity increase 95% Global, 2020–2025 (forecast) 1
Share of global hydropower capacity additions 40% China, 2025 1
Share of global new renewable capacity added 60% China, 2023 1
Share of global new wind and solar PV capacity installed in China 33.3% China, 2017–2040 (forecast) 1
Share of global renewable capacity expansion to 2030 60% China, 2024–2030 (forecast) 1
Share of global renewable capacity growth 40% China, 2017–2022 (forecast) 1
Share of global solar PV capacity expansion 50% China, 2016 1
Share of renewable capacity additions increase by country 30% China, 2022 (forecast) 1
Share of renewable capacity installations 60% China, 2024–2030 (forecast) 1
Share of renewables growth from market-based settings 5% Global, 2020 1
Share of renewables in new power capacity 80% European Union, 2017–2040 (forecast) 1
Solar PV and wind capacity additions growth rate (Accelerated Case) 25% Global, 2022 (forecast) 1
Solar PV and wind share of renewable capacity growth to 2030 95% Global, 2024–2030 (forecast) 1
Solar PV annual capacity additions 150 gigawatts Global, 2022 (forecast) 1
Solar PV annual market growth rate 40% Global, 2019–2022 (forecast) 1
Solar PV share of renewable capacity additions 60% Global, 2020–2025 (forecast) 1
Utility-scale battery storage capacity addition (snapshot) 1.4 gigawatts United States, end of 2022 (forecast) 1
Wind and hydropower share of power capacity increase 90% Global, 2020 1
Wind capacity expansion rate growth multiple 2 multiple Global, 2024–2030 (forecast) 1
Wind share of renewable capacity additions 30% Global, 2020–2025 (forecast) 1

Power capacity additions by country

Countries ranked on one comparable period:

A page for every country with at least three records:

Frequently asked questions

What does power capacity additions measure?

New electricity generation or storage capacity added to the grid.

What is the latest new wind power capacity installed?

China had the highest new wind power capacity installed in 2025, at 120.5 gigawatts, ahead of United States (6.9 gigawatts) and India (6.3 gigawatts). Global: 165 gigawatts in 2025.

Which country has the highest new wind power capacity installed?

China, at 120.5 gigawatts in 2025, among 5 countries that published that period.

Which countries does this power capacity additions data cover?

5 countries, with a page each for China, United States, India.

Where does the data come from?

From 17 documents published by IEA, EIA, GWEC and 1 more. Every figure links to its record, which quotes the sentence or table row it was read from.

How often is it updated?

Annual; the newest figure covers 2025, and the next release should cover 2026.

Sources

17 documents from 4 publishers. Each links to the publisher's own copy.

Cite this page

Published under CC BY 4.0: free to reuse, including commercially, with attribution to StatOrigin and the original publisher. To cite one figure, open its record.

StatOrigin. (2026). Power capacity additions statistics [Data set]. Retrieved September 29, 2026, from https://statorigin.org/statistics/power-capacity-additions

"Power capacity additions statistics." StatOrigin, 2026, https://statorigin.org/statistics/power-capacity-additions. Accessed 29 Sep. 2026.

StatOrigin. "Power capacity additions statistics." Data set, 2026. Accessed September 29, 2026. https://statorigin.org/statistics/power-capacity-additions.

@misc{statorigin_power_capacity_additions_2026, title = {Power capacity additions statistics}, author = {{StatOrigin}}, year = {2026}, url = {https://statorigin.org/statistics/power-capacity-additions}, note = {Data set. Accessed 2026-09-29} }