Ranking · 190 countries · 2025
Fixed broadband basket price as share of GNI per capita by country
Liberia had the highest fixed broadband basket price as share of GNI per capita in 2025, at 146.8%, followed by the Central African Republic (76.6%) and Niger (51%). The ranking compares 190 countries on 2025 figures from the International Telecommunication Union. Monaco was the cheapest, at 0.2%.
How this ranking is built. Indicator: Fixed broadband basket price as share of GNI per capita · Industry: Telecommunications · Period: 2025. Only verified actual figures for that one period are ranked, so every row is comparable; forecasts are not ranked, and world or regional totals are shown as reference, not ranked. 12 other countries have data only for other periods and are omitted.
Visualised
Ranked chart
World map
2025 · %. Grey means no observation on this map. Small territories remain in the table.
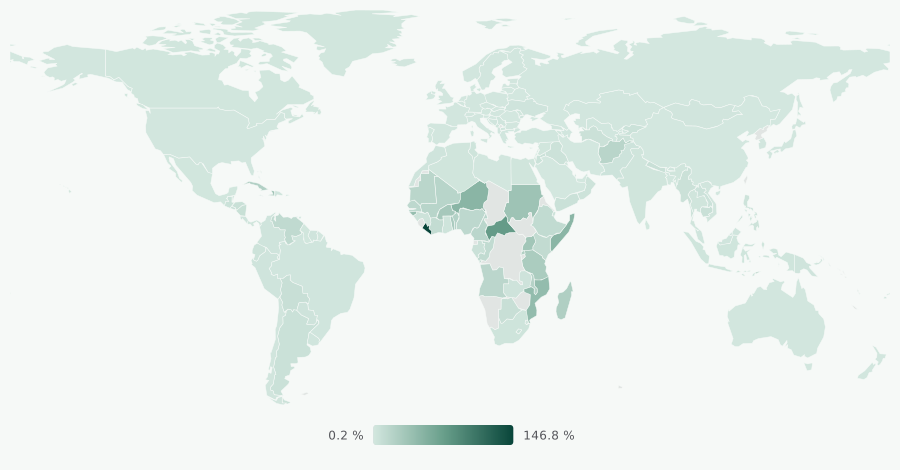
Sources: the same published records as the ranking. Geometry: Natural Earth, public domain. Download SVG.
The table
Country ranking
Rank · country · value · change on the same period a year earlier · source. Values in %.
Ranks 1–50 of 190 countries. Page 1 of 4.
| # | Country | Value | YoY | Period | Source |
|---|---|---|---|---|---|
| 1 | Liberia LR | 146.8% | -4.0% | 2025 | International Telecommunication Union |
| 2 | Central African Republic CF | 76.6% | — | 2025 | International Telecommunication Union |
| 3 | Niger NE | 51% | -16.6% | 2025 | International Telecommunication Union |
| 4 | Somalia SO | 50% | -15.3% | 2025 | International Telecommunication Union |
| 5 | Mozambique MZ | 44.2% | -3.6% | 2025 | International Telecommunication Union |
| 6 | Guinea-Bissau GW | 42.3% | -21.3% | 2025 | International Telecommunication Union |
| 7 | Timor-Leste TL | 37.7% | +37.2% | 2025 | International Telecommunication Union |
| 8 | Haiti HT | 37.5% | -1.1% | 2025 | International Telecommunication Union |
| 9 | Sudan SD | 36.6% | — | 2025 | International Telecommunication Union |
| 10 | Uganda UG | 34% | -5.7% | 2025 | International Telecommunication Union |
| 11 | Burkina Faso BF | 31.4% | +6.5% | 2025 | International Telecommunication Union |
| 12 | Togo TG | 28.4% | -2.7% | 2025 | International Telecommunication Union |
| 13 | Tanzania TZ | 27.9% | — | 2025 | International Telecommunication Union |
| 14 | Madagascar MG | 24.5% | -52.7% | 2025 | International Telecommunication Union |
| 15 | Comoros KM | 23.7% | -11.2% | 2025 | International Telecommunication Union |
| 16 | Rwanda RW | 23.3% | -11.5% | 2025 | International Telecommunication Union |
| 17 | Cuba CU | 23.3% | -28.5% | 2025 | International Telecommunication Union |
| 18 | Benin BJ | 21.5% | -3.1% | 2025 | International Telecommunication Union |
| 19 | Malawi MW | 21.1% | -55.0% | 2025 | International Telecommunication Union |
| 20 | Mali ML | 18.6% | -18.8% | 2025 | International Telecommunication Union |
| 21 | Afghanistan AF | 18.3% | -4.4% | 2025 | International Telecommunication Union |
| 22 | Mauritania MR | 17.6% | +15.4% | 2025 | International Telecommunication Union |
| 23 | Cameroon CM | 17.1% | -5.3% | 2025 | International Telecommunication Union |
| 24 | Angola AO | 17.1% | +11.3% | 2025 | International Telecommunication Union |
| 25 | Vanuatu VU | 15.7% | -5.5% | 2025 | International Telecommunication Union |
| 26 | Nigeria NG | 15.5% | -10.7% | 2025 | International Telecommunication Union |
| 27 | Senegal SN | 15.1% | -0.1% | 2025 | International Telecommunication Union |
| 28 | Venezuela VE | 13.5% | -67.8% | 2025 | International Telecommunication Union |
| 29 | Congo CG | 12.5% | -39.9% | 2025 | International Telecommunication Union |
| 30 | Sao Tome and Principe ST | 12.5% | -20.7% | 2025 | International Telecommunication Union |
| 31 | Ethiopia ET | 12.4% | +17.5% | 2025 | International Telecommunication Union |
| 32 | Kenya KE | 12.3% | -8.4% | 2025 | International Telecommunication Union |
| 33 | Cote d'Ivoire CI | 11.4% | +0.7% | 2025 | International Telecommunication Union |
| 34 | Samoa WS | 11.3% | -16.0% | 2025 | International Telecommunication Union |
| 35 | Tuvalu TV | 9.94% | -13.9% | 2025 | International Telecommunication Union |
| 36 | Bolivia BO | 7.99% | -1.5% | 2025 | International Telecommunication Union |
| 37 | Botswana BW | 7.93% | +38.2% | 2025 | International Telecommunication Union |
| 38 | Nicaragua NI | 7.62% | -9.8% | 2025 | International Telecommunication Union |
| 39 | Honduras HN | 7.43% | -30.9% | 2025 | International Telecommunication Union |
| 40 | Jamaica JM | 7.4% | -4.0% | 2025 | International Telecommunication Union |
| 41 | Nepal NP | 7.28% | +1.3% | 2025 | International Telecommunication Union |
| 42 | Marshall Islands MH | 7.15% | -9.7% | 2025 | International Telecommunication Union |
| 43 | Cambodia KH | 7.14% | -28.2% | 2025 | International Telecommunication Union |
| 44 | Argentina AR | 6.71% | -51.2% | 2025 | International Telecommunication Union |
| 45 | Gabon GA | 6.63% | +1.4% | 2025 | International Telecommunication Union |
| 46 | Yemen YE | 6.28% | +22.9% | 2025 | International Telecommunication Union |
| 47 | Turkmenistan TM | 6.06% | +22.4% | 2025 | International Telecommunication Union |
| 48 | Myanmar MM | 5.96% | -6.4% | 2025 | International Telecommunication Union |
| 49 | El Salvador SV | 5.86% | -19.9% | 2025 | International Telecommunication Union |
| 50 | Jordan JO | 5.65% | -14.7% | 2025 | International Telecommunication Union |
| — | North America Reference total, not ranked | 5.36% | +6.8% | 2025 | International Telecommunication Union |
Frequently asked questions
Which country has the highest fixed broadband basket price as share of GNI per capita?
Liberia, at 146.8% in 2025, ahead of the Central African Republic (76.6%) and Niger (51%), among 190 countries ranked on 2025 figures from the International Telecommunication Union.
Which country has the lowest fixed broadband basket price as share of GNI per capita?
Monaco, at 0.2% in 2025, then Iran (0.2%).
What does this ranking measure?
Price of the ITU fixed broadband basket in the economy, expressed as a percentage of gross national income (GNI) per capita.
Which countries are included?
190 countries with 2025 figures: Liberia, Central African Republic, Niger, Somalia, Mozambique, Guinea-Bissau, Timor-Leste, Haiti, Sudan, Uganda, Burkina Faso and Togo and 178 more. 12 other countries published figures only for other periods and are left out, so every row compares the same period.
Where does the data come from?
From the International Telecommunication Union. Every value links to its record, which quotes the table or sentence it was read from. Only actual figures are ranked; forecasts are left out.
Cite & reuse
Cite this ranking
Published under CC BY 4.0.
StatOrigin. (2026). Fixed broadband basket price as share of GNI per capita by country, 2025. Retrieved from https://statorigin.org/rankings/fixed-broadband-basket-price-share-of-gni-by-country