J62 · Software and IT Services · 4 measures · 14 regions
Business technology adoption
Finland had the highest enterprises using paid cloud computing services in 2025, at 79.2%, ahead of Italy (75.6%) and Malta (74.9%).
- 79.2% Enterprises using paid cloud computing services · Finland · 2025
- 4Measures
- 13Countries · 2025–2026
Verified 22 Sep 2026 · 2 publishers · 17 records · Next period 2026
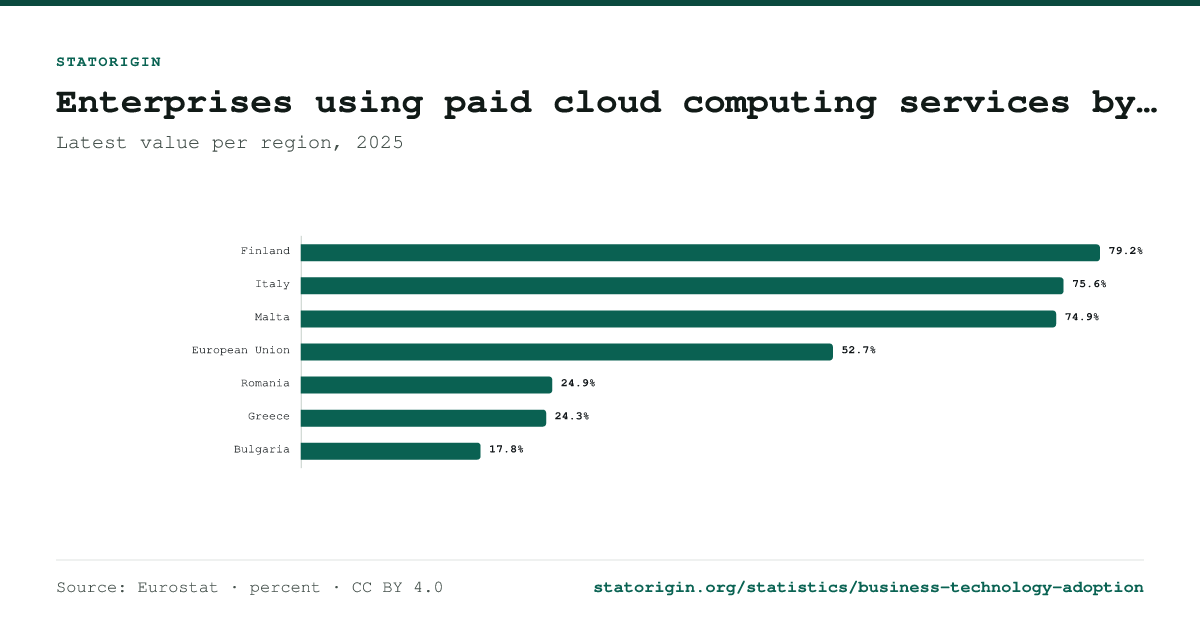
Enterprises using paid cloud computing services
The best-covered measure of business technology adoption. Every point opens its record; the values are one click away under the chart.
Enterprises using paid cloud computing services by region
Latest value per region, 2025
View the underlying data
Every measure of business technology adoption
4 measures: the same subject cut by product, segment, basis or form. Each has its own page with every record.
| Measure | Latest | Where and when | Records |
|---|---|---|---|
| Enterprises using paid cloud computing services | 52.7% | European Union, 2025 | 7 |
| Enterprises using ERP software applications | 46.5% | European Union, 2025 | 5 |
| U.S. businesses currently using AI (last two weeks) | 23.2% | United States, as of 6 Sep 2026 | 3 |
| Enterprises performing data analytics by own employees or external provider | 56% | Netherlands, 2025 | 2 |
Business technology adoption by country
Countries ranked on one comparable period:
A page for every country with at least three records:
Frequently asked questions
What does business technology adoption measure?
The proportion of enterprises adopting or utilizing a specified technology or digital practice.
What is the latest enterprises using paid cloud computing services?
Finland had the highest enterprises using paid cloud computing services in 2025, at 79.2%, ahead of Italy (75.6%) and Malta (74.9%).
Which country has the highest enterprises using paid cloud computing services?
Finland, at 79.2% in 2025, among 6 countries that published that period.
Which countries does this business technology adoption data cover?
13 countries, with a page each for United States.
Where does the data come from?
From 2 documents published by Eurostat and Census Bureau. Every figure links to its record, which quotes the sentence or table row it was read from.
How often is it updated?
Annual; the newest figure covers 2025, and the next release should cover 2026.
Sources
2 documents from 2 publishers. Each links to the publisher's own copy.
| Document | Publisher | Published | Data points |
|---|---|---|---|
| Digital economy and society statistics | Eurostat | — | 14 |
| BTOS: National AI use — dashboard data | Census Bureau | 10 Sep 2026 | 3 |
Cite this page
Published under CC BY 4.0: free to reuse, including commercially, with attribution to StatOrigin and the original publisher. To cite one figure, open its record.
StatOrigin. (2026). Business technology adoption statistics [Data set]. Retrieved September 29, 2026, from https://statorigin.org/statistics/business-technology-adoption
"Business technology adoption statistics." StatOrigin, 2026, https://statorigin.org/statistics/business-technology-adoption. Accessed 29 Sep. 2026.
StatOrigin. "Business technology adoption statistics." Data set, 2026. Accessed September 29, 2026. https://statorigin.org/statistics/business-technology-adoption.
@misc{statorigin_business_technology_adoption_2026, title = {Business technology adoption statistics}, author = {{StatOrigin}}, year = {2026}, url = {https://statorigin.org/statistics/business-technology-adoption}, note = {Data set. Accessed 2026-09-29} }