C20 · Chemicals · 9 measures · 3 regions
Chemical production
China: 3.6 million tonnes in August 2026, +3.4% on July 2026.
- 3.6 million tonnes Ethylene production · China · August 2026
- +3.4% vs July 2026
- 9Measures
- 2Countries · 2004–2026
Verified 27 Sep 2026 · 3 publishers · 11 records · Next period September 2026
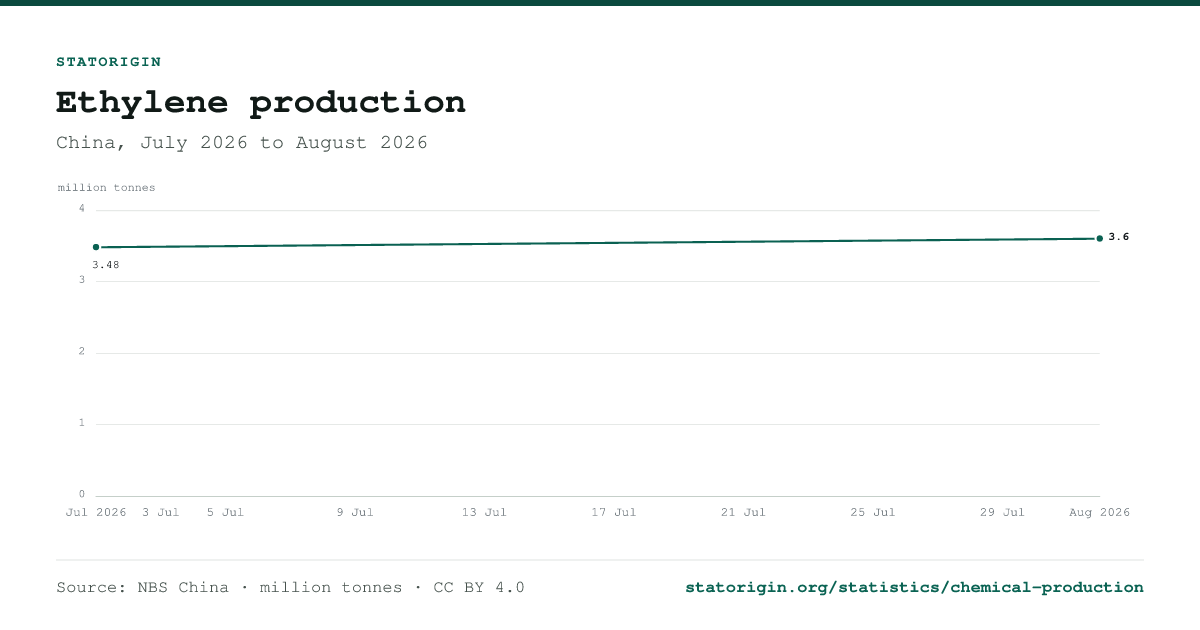
Ethylene production
The best-covered measure of chemical production. Every point opens its record; the values are one click away under the chart.
Ethylene production
China, July 2026 to August 2026
View the underlying data
| Period | Type | Value |
|---|---|---|
| July 2026 | Actual | 3.48 million tonnes |
| August 2026 | Actual | 3.6 million tonnes |
Every measure of chemical production
9 measures: the same subject cut by product, segment, basis or form. Each has its own page with every record.
| Measure | Latest | Where and when | Records |
|---|---|---|---|
| Decrease in production of chemicals hazardous to the environment | 17 million tonnes | European Union, 2004–2024 | 2 |
| Ethylene production | 3.6 million tonnes | China, August 2026 | 2 |
| Decrease in production of substances of concern for the environment | 12 million tonnes | European Union, 2004–2024 | 1 |
| Ethylene production growth rate | 0.1% | China, July 2026 | 1 |
| Plastic resin production | 9 billion pounds | United States, July 2026 | 1 |
| Plastic resin production (year-to-date) (year to date) | 62.3 billion pounds | United States, January–July 2026 | 1 |
| Plastic resin production growth rate (monthly) | 2.3% | United States, July 2026 | 1 |
| Plastic resin production growth rate (year-over-year) | -2.9% | United States, July 2026 | 1 |
| Plastic resin production growth rate (year-to-date) (year to date) | 5.1% | United States, January–July 2026 | 1 |
Chemical production by country
A page for every country with at least three records:
Frequently asked questions
What does chemical production measure?
The total quantity or volume of goods produced.
What is the latest ethylene production?
China: 3.6 million tonnes in August 2026, +3.4% on July 2026.
Which countries does this chemical production data cover?
2 countries, with a page each for United States, China.
Where does the data come from?
From 4 documents published by Eurostat, NBS China, ACC. Every figure links to its record, which quotes the sentence or table row it was read from.
How often is it updated?
Monthly; the newest figure covers August 2026, and the next release should cover September 2026.
Sources
4 documents from 3 publishers. Each links to the publisher's own copy.
| Document | Publisher | Published | Data points |
|---|---|---|---|
| Industrial Production Operation in August 2026 | NBS China | — | 1 |
| Industrial Production Operation in July 2026 | NBS China | — | 2 |
| Chemicals production and consumption statistics | Eurostat | — | 3 |
| ACC Releases July 2026 Resin Production and Sales Statistics | ACC | — | 5 |
Cite this page
Published under CC BY 4.0: free to reuse, including commercially, with attribution to StatOrigin and the original publisher. To cite one figure, open its record.
StatOrigin. (2026). Chemical production statistics [Data set]. Retrieved September 29, 2026, from https://statorigin.org/statistics/chemical-production
"Chemical production statistics." StatOrigin, 2026, https://statorigin.org/statistics/chemical-production. Accessed 29 Sep. 2026.
StatOrigin. "Chemical production statistics." Data set, 2026. Accessed September 29, 2026. https://statorigin.org/statistics/chemical-production.
@misc{statorigin_chemical_production_2026, title = {Chemical production statistics}, author = {{StatOrigin}}, year = {2026}, url = {https://statorigin.org/statistics/chemical-production}, note = {Data set. Accessed 2026-09-29} }