C29 · Electric Vehicles · 22 measures · 11 regions

Electric vehicle sales

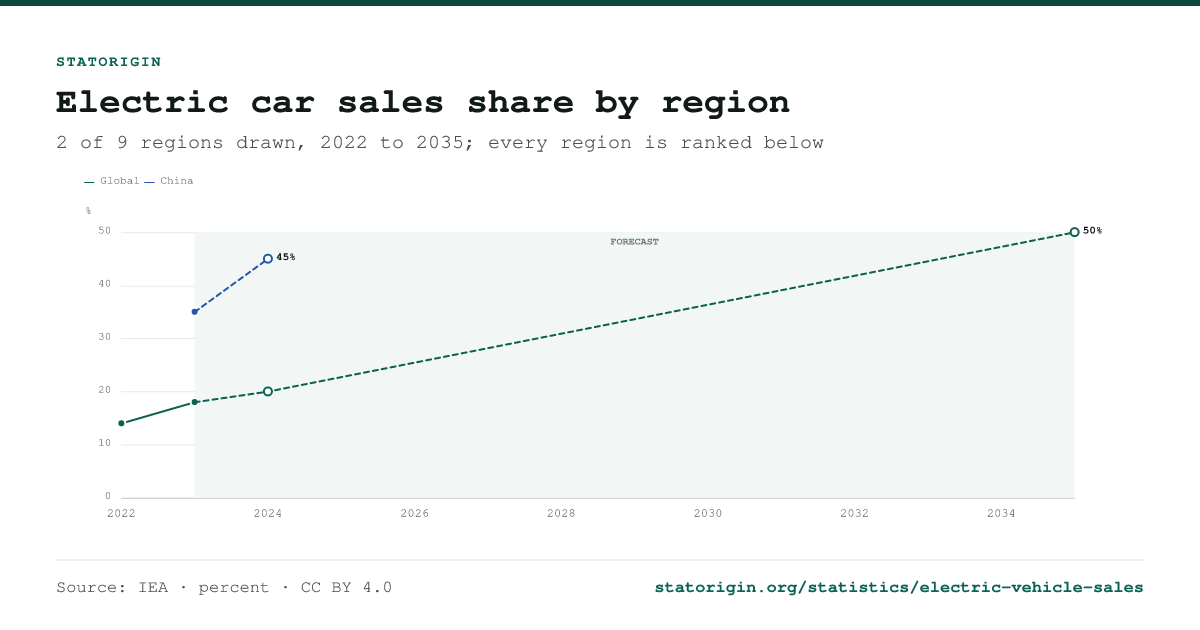
China had the highest electric car sales share in 2023, at 35%, ahead of Vietnam (15%) and Thailand (10%). Global: 18% in 2023, +4.0 pp on 2022. IEA projects 50% for 2035.

  • 18% Electric car sales share · Global · 2023
  • +4.0 pp vs 2022
  • 22Measures
  • 7Countries · 2022–2024

Verified 27 Sep 2026 · 1 publisher · 51 records · Next period 2024
CSV JSON PNG

Electric car sales share

The best-covered measure of electric vehicle sales. Every point opens its record; the values are one click away under the chart.

Fig 1 · C29 · Electric car sales share Annual

Electric car sales share by region

2 of 9 regions drawn, 2022 to 2035; every region is ranked below

2 regions · 6 observations · 2022 to 2035

Forecast: dashed line, hollow markers, shaded band

Electric car sales share by regionElectric car sales share by region. 2 regions on one axis: Global, China. 6 observations from 2022 to 2035, ranging from 14% to 50%, of which 3 are forecasts. Latest values: Global 50% (2035); China 45% (2024). % 0 10 20 30 40 50 2022 2024 2026 2028 2030 2032 2034 FORECAST Global China 50% 45%
Electric car sales share by regionElectric car sales share by region. 2 regions on one axis: Global, China. 6 observations from 2022 to 2035, ranging from 14% to 50%, of which 3 are forecasts. Latest values: Global 50% (2035); China 45% (2024). % 0 20 40 60 2022 2024 2026 2028 2030 2032 2034 FORECAST Global China 50% 45%
View the underlying data
Electric car sales share by region
Region Period Type Value
Global 2035 Forecast 50%
Global 2024 Forecast 20%
Global 2023 Actual 18%
Global 2022 Actual 14%
China 2024 Forecast 45%
China 2023 Actual 35%
Source: IEA · percent · CC BY 4.0 · statorigin.org
Embed

Free to embed, including commercially. The attribution bar is part of the chart; it is what keeps the data citable.

<iframe src="https://statorigin.org/embed/electric-vehicles--electric-car-sales-share--regions" width="100%" height="380" style="border:1px solid #e2e5e3;border-radius:8px" title="Electric car sales share by region" loading="lazy"></iframe>
<p><a href="https://statorigin.org/statistics/electric-vehicle-sales">Electric car sales share by region</a>, data from StatOrigin, CC BY 4.0</p>
Preview embed

Forecasts are dashed, with hollow markers.

Fig 2 · C29 · Latest by region

Electric car sales share by region

Latest value per region, periods differ

9 entries

Forecast Latest available period per row; periods differ

Electric car sales share by regionElectric car sales share by region. 9 categories, highest is China at 35%. Bars refer to different periods; each is labelled with its own. Indonesia 2023 India 2023 Brazil 2023 Thailand 2023 United States 2024 Vietnam 2023 Europe 2024 China 2023 Global 2023 2% 2% 3% 10% 11% 15% 25% 35% 18%
View the underlying data
Electric car sales share by region
Category Period Source Type Value
Global 2023 IEA Actual 18%
China 2023 IEA Actual 35%
Europe 2024 IEA Forecast 25%
Vietnam 2023 IEA Actual 15%
United States 2024 IEA Forecast 11%
Thailand 2023 IEA Actual 10%
Brazil 2023 IEA Actual 3%
India 2023 IEA Actual 2%
Indonesia 2023 IEA Actual 2%
Source: IEA · percent · CC BY 4.0 · statorigin.org
Embed

Free to embed, including commercially. The attribution bar is part of the chart; it is what keeps the data citable.

<iframe src="https://statorigin.org/embed/electric-vehicles--electric-car-sales-share--by-region" width="100%" height="380" style="border:1px solid #e2e5e3;border-radius:8px" title="Electric car sales share by region" loading="lazy"></iframe>
<p><a href="https://statorigin.org/statistics/electric-vehicle-sales">Electric car sales share by region</a>, data from StatOrigin, CC BY 4.0</p>
Preview embed

Forecast bars are tinted. Latest available period per row; years differ.

Every measure of electric vehicle sales

22 measures: the same subject cut by product, segment, basis or form. Each has its own page with every record.

Electric vehicle sales by country

Countries ranked on one comparable period:

A page for every country with at least three records:

Frequently asked questions

What does electric vehicle sales measure?

Number of new electric vehicles sold in a given period.

What is the latest electric car sales share?

China had the highest electric car sales share in 2023, at 35%, ahead of Vietnam (15%) and Thailand (10%). Global: 18% in 2023, +4.0 pp on 2022. IEA projects 50% for 2035.

Which country has the highest electric car sales share?

China, at 35% in 2023, among 6 countries that published that period.

Which countries does this electric vehicle sales data cover?

7 countries, with a page each for China, India, Vietnam.

Where does the data come from?

From 4 documents published by IEA. Every figure links to its record, which quotes the sentence or table row it was read from.

How often is it updated?

Annual; the newest figure covers 2023, and the next release should cover 2024.

Sources

4 documents from 1 publisher. Each links to the publisher's own copy.

Cite this page

Published under CC BY 4.0: free to reuse, including commercially, with attribution to StatOrigin and the original publisher. To cite one figure, open its record.

StatOrigin. (2026). Electric vehicle sales statistics [Data set]. Retrieved September 29, 2026, from https://statorigin.org/statistics/electric-vehicle-sales

"Electric vehicle sales statistics." StatOrigin, 2026, https://statorigin.org/statistics/electric-vehicle-sales. Accessed 29 Sep. 2026.

StatOrigin. "Electric vehicle sales statistics." Data set, 2026. Accessed September 29, 2026. https://statorigin.org/statistics/electric-vehicle-sales.

@misc{statorigin_electric_vehicle_sales_2026, title = {Electric vehicle sales statistics}, author = {{StatOrigin}}, year = {2026}, url = {https://statorigin.org/statistics/electric-vehicle-sales}, note = {Data set. Accessed 2026-09-29} }