Ranking · 185 countries · 2025
GDP (current US$) by country (2025)
The United States had the highest GDP (current US$) in 2025, at 30,769,700,000,000 USD, followed by China (19,498,039,388,042.6 USD) and Germany (5,050,922,925,047 USD). The ranking compares 185 countries on 2025 figures from the World Bank. Tuvalu ranked last of the 185, at 57,345,434.7 USD.
How this ranking is built. Indicator: GDP (current US$) · Topic: GDP · Industry: Economy · Period: 2025. Only verified actual figures for that one period are ranked, so every row is comparable; forecasts are not ranked, and world or regional totals are shown as reference, not ranked. 22 other countries have data only for other periods and are omitted.
Visualised
Ranked chart
GDP (current US$) by country
2025 · 12 highest of 185 countries
World map
2025 · USD. Grey means no observation on this map. Small territories remain in the table.
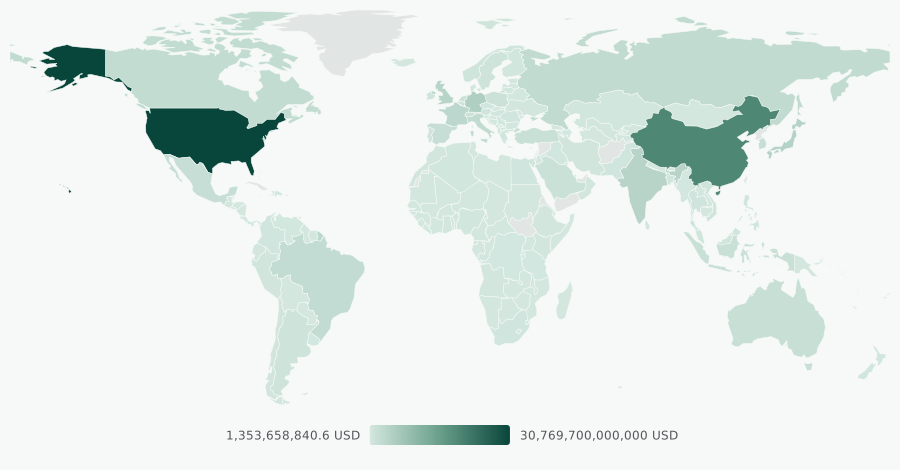
Sources: the same published records as the ranking. Geometry: Natural Earth, public domain. Download SVG.
The table
Country ranking
Rank · country · value · change on the same period a year earlier · source. Values in USD.
Ranks 1–50 of 185 countries. Page 1 of 4.
| # | Country | Value | YoY | Period | Source |
|---|---|---|---|---|---|
| 1 | United States US | 30,769,700,000,000 USD | +5.0% | 2025 | World Bank |
| 2 | China CN | 19,498,039,388,042.6 USD | +4.1% | 2025 | World Bank |
| 3 | Germany DE | 5,050,922,925,047 USD | +7.8% | 2025 | World Bank |
| 4 | Japan JP | 4,435,162,999,976.9 USD | +5.9% | 2025 | World Bank |
| 5 | United Kingdom GB | 4,002,587,541,846 USD | +8.3% | 2025 | World Bank |
| 6 | India IN | 3,956,067,115,771.6 USD | +5.2% | 2025 | World Bank |
| 7 | France FR | 3,366,315,927,447.3 USD | +6.5% | 2025 | World Bank |
| 8 | Russia RU | 2,561,310,169,358.7 USD | +17.1% | 2025 | World Bank |
| 9 | Italy IT | 2,551,556,954,100.4 USD | +7.1% | 2025 | World Bank |
| 10 | Canada CA | 2,319,899,772,425.9 USD | +2.2% | 2025 | World Bank |
| 11 | Brazil BR | 2,279,920,092,492.1 USD | +4.3% | 2025 | World Bank |
| 12 | Spain ES | 1,906,453,309,985.9 USD | +10.5% | 2025 | World Bank |
| 13 | South Korea KR | 1,872,374,961,553.1 USD | -0.2% | 2025 | World Bank |
| 14 | Mexico MX | 1,832,641,364,775.5 USD | +0.1% | 2025 | World Bank |
| 15 | Australia AU | 1,798,518,933,689.2 USD | +2.4% | 2025 | World Bank |
| 16 | Turkiye TR | 1,597,293,229,287 USD | +17.5% | 2025 | World Bank |
| 17 | Indonesia ID | 1,445,642,584,163.8 USD | +3.5% | 2025 | World Bank |
| 18 | Netherlands NL | 1,332,767,651,100.4 USD | +9.8% | 2025 | World Bank |
| 19 | Saudi Arabia SA | 1,276,942,933,333.3 USD | +1.8% | 2025 | World Bank |
| 20 | Switzerland CH | 1,043,529,899,250.9 USD | +7.6% | 2025 | World Bank |
| 21 | Poland PL | 1,035,491,784,197.4 USD | +12.8% | 2025 | World Bank |
| 22 | Belgium BE | 725,466,462,859.6 USD | +8.1% | 2025 | World Bank |
| 23 | Ireland IE | 721,701,359,046.3 USD | +18.5% | 2025 | World Bank |
| 24 | Argentina AR | 683,097,891,618.6 USD | +7.0% | 2025 | World Bank |
| 25 | Sweden SE | 668,998,664,082.1 USD | +10.6% | 2025 | World Bank |
| 26 | Israel IL | 610,777,842,873.6 USD | +12.6% | 2025 | World Bank |
| 27 | Singapore SG | 603,869,516,998.7 USD | +5.4% | 2025 | World Bank |
| 28 | Austria AT | 579,470,021,095.4 USD | +8.4% | 2025 | World Bank |
| 29 | Thailand TH | 577,009,981,112 USD | +9.0% | 2025 | World Bank |
| 30 | Norway NO | 530,755,719,438.9 USD | +6.0% | 2025 | World Bank |
| 31 | Vietnam VN | 514,697,215,165.1 USD | +8.1% | 2025 | World Bank |
| 32 | Philippines PH | 487,086,123,720.4 USD | +5.5% | 2025 | World Bank |
| 33 | Malaysia MY | 472,193,128,644.6 USD | +11.8% | 2025 | World Bank |
| 34 | Denmark DK | 462,526,660,468.4 USD | +9.0% | 2025 | World Bank |
| 35 | Colombia CO | 457,410,034,202.5 USD | +8.8% | 2025 | World Bank |
| 36 | Bangladesh BD | 456,319,229,255.6 USD | +1.4% | 2025 | World Bank |
| 37 | Romania RO | 428,677,977,854.8 USD | +12.1% | 2025 | World Bank |
| 38 | Hong Kong, China HK | 427,310,315,922 USD | +4.6% | 2025 | World Bank |
| 39 | South Africa ZA | 427,184,325,997.3 USD | +6.5% | 2025 | World Bank |
| 40 | Pakistan PK | 407,307,214,476.2 USD | +9.6% | 2025 | World Bank |
| 41 | Czechia CZ | 391,026,962,800.5 USD | +12.7% | 2025 | World Bank |
| 42 | Egypt EG | 365,254,630,179.7 USD | -6.1% | 2025 | World Bank |
| 43 | Iran IR | 362,682,115,433.4 USD | -23.7% | 2025 | World Bank |
| 44 | Chile CL | 357,371,159,574.9 USD | +8.5% | 2025 | World Bank |
| 45 | Portugal PT | 346,639,825,141.8 USD | +10.5% | 2025 | World Bank |
| 46 | Peru PE | 334,854,659,181.9 USD | +14.8% | 2025 | World Bank |
| 47 | Finland FI | 317,039,368,819.6 USD | +6.1% | 2025 | World Bank |
| 48 | Kazakhstan KZ | 306,239,209,650 USD | +5.1% | 2025 | World Bank |
| 49 | Nigeria NG | 290,794,361,542.1 USD | +15.3% | 2025 | World Bank |
| 50 | Algeria DZ | 287,031,225,987.7 USD | +6.6% | 2025 | World Bank |
Frequently asked questions
Which country has the highest GDP (current US$)?
The United States, at 30,769,700,000,000 USD in 2025, ahead of China (19,498,039,388,042.6 USD) and Germany (5,050,922,925,047 USD), among 185 countries ranked on 2025 figures from the World Bank.
Which country has the lowest GDP (current US$)?
Tuvalu, at 57,345,434.7 USD in 2025, then Nauru (176,040,043.9 USD).
What does this ranking measure?
Gross domestic product in current United States dollars. Total income earned through the production of goods and services in an economic territory during an accounting period.
Which countries are included?
185 countries with 2025 figures: United States, China, Germany, Japan, United Kingdom, India, France, Russia, Italy, Canada, Brazil and Spain and 173 more. 22 other countries published figures only for other periods and are left out, so every row compares the same period.
Where does the data come from?
From the World Bank. Every value links to its record, which quotes the table or sentence it was read from. Only actual figures are ranked; forecasts are left out.
Cite & reuse
Cite this ranking
Published under CC BY 4.0.
StatOrigin. (2026). GDP (current US$) by country, 2025. Retrieved from https://statorigin.org/rankings/gdp-current-usd-by-country