TOPIC_ECONOMY · Economy · 207 regions
GDP growth (annual %)
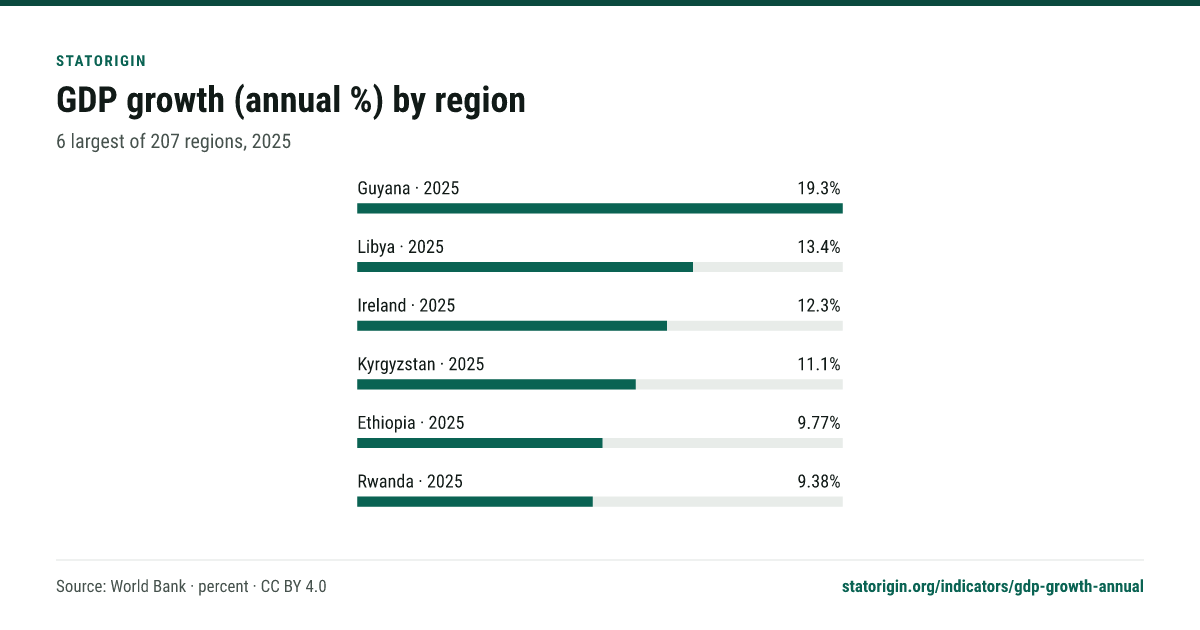
Guyana had the highest GDP growth (annual %) in 2025, at 19.3%, ahead of Libya (13.4%) and Ireland (12.3%).
- 19.3% Latest · Guyana · 2025
- −24.5 pp vs 2024
- Annual Release cadence
- 11,275 Records · 207 regions · 1961–2025
Verified 2 Oct 2026 · 1 publisher · Next period 2026
By region
Each region's latest published value, the 6 largest of 207. Periods differ where publishers release on different schedules; the period sits under each name.
GDP growth (annual %) by region
6 largest of 207 regions, 2025
Record preview
11,275 records · 207 regions · 1961–2025. Each period links to its record: the value, its source evidence and original document.
Showing 6 recent records from the first 6 regions in the overview. Download all 11275 records (CSV) or read a regional JSON series.
| Period | Value | Source | Type |
|---|---|---|---|
| Guyana 1 record | |||
| 2025 | 19.3% | World Bank · 31 Dec 2025 | |
| Libya 1 record | |||
| 2025 | 13.4% | World Bank · 31 Dec 2025 | |
| Ireland 1 record | |||
| 2025 | 12.3% | World Bank · 31 Dec 2025 | |
| Kyrgyzstan 1 record | |||
| 2025 | 11.1% | World Bank · 31 Dec 2025 | |
| Ethiopia 1 record | |||
| 2025 | 9.77% | World Bank · 31 Dec 2025 | |
| Rwanda 1 record | |||
| 2025 | 9.38% | World Bank · 31 Dec 2025 | |
Explore by country
Open a country for its time series and source records. Countries with fewer than three records link to their JSON series.
- Afghanistan
- Albania
- Algeria
- Andorra
- Angola
- Antigua and Barbuda
- Argentina
- Armenia
- Aruba
- Australia
- Austria
- Azerbaijan
- Bahamas
- Bahrain
- Bangladesh
- Barbados
- Belarus
- Belgium
- Belize
- Benin
- Bermuda
- Bhutan
- Bolivia
- Bosnia and Herzegovina
- Botswana
- Brazil
- Brunei
- Bulgaria
- Burkina Faso
- Burundi
- Cabo Verde
- Cambodia
- Cameroon
- Canada
- Cayman Islands
- Central African Republic
- Chad
- Chile
- China
- Colombia
- Comoros
- Congo
- Costa Rica
- Cote d'Ivoire
- Croatia
- Cuba
- Curacao
- Cyprus
- Czechia
- Democratic Republic of the Congo
- Denmark
- Djibouti
- Dominica
- Dominican Republic
- Ecuador
- Egypt
- El Salvador
- Equatorial Guinea
- Eritrea
- Estonia
- Eswatini
- Ethiopia
- Faroe Islands
- Fiji
- Finland
- France
- French Polynesia
- Gabon
- Gambia
- Georgia
- Germany
- Ghana
- Greece
- Greenland
- Grenada
- Guam
- Guatemala
- Guinea
- Guinea-Bissau
- Guyana
- Haiti
- Honduras
- Hong Kong, China
- Hungary
- Iceland
- India
- Indonesia
- Iran
- Iraq
- Ireland
- Israel
- Italy
- Jamaica
- Japan
- Jordan
- Kazakhstan
- Kenya
- Kiribati
- Kosovo
- Kuwait
- Kyrgyzstan
- Laos
- Latvia
- Lebanon
- Lesotho
- Liberia
- Libya
- Liechtenstein
- Lithuania
- Luxembourg
- Macao, China
- Madagascar
- Malawi
- Malaysia
- Maldives
- Mali
- Malta
- Marshall Islands
- Mauritania
- Mauritius
- Mexico
- Micronesia
- Moldova
- Monaco
- Mongolia
- Montenegro
- Morocco
- Mozambique
- Myanmar
- Namibia
- Nauru
- Nepal
- Netherlands
- New Caledonia
- New Zealand
- Nicaragua
- Niger
- Nigeria
- North Macedonia
- Norway
- Oman
- Pakistan
- Palau
- Palestine
- Panama
- Papua New Guinea
- Paraguay
- Peru
- Philippines
- Poland
- Portugal
- Puerto Rico (US)
- Qatar
- Romania
- Russia
- Rwanda
- Saint Kitts and Nevis
- Saint Lucia
- Saint Vincent and the Grenadines
- Samoa
- San Marino
- Sao Tome and Principe
- Saudi Arabia
- Senegal
- Serbia
- Seychelles
- Sierra Leone
- Singapore
- Slovakia
- Slovenia
- Solomon Islands
- Somalia
- South Africa
- South Korea
- South Sudan
- Spain
- Sri Lanka
- Sudan
- Suriname
- Sweden
- Switzerland
- Syria
- Tajikistan
- Tanzania
- Thailand
- Timor-Leste
- Togo
- Tonga
- Trinidad and Tobago
- Tunisia
- Turkiye
- Turkmenistan
- Tuvalu
- Uganda
- Ukraine
- United Arab Emirates
- United Kingdom
- United States
- Uruguay
- Uzbekistan
- Vanuatu
- Venezuela
- Vietnam
- Virgin Islands (U.S.)
- Yemen
- Zambia
- Zimbabwe
Download this data
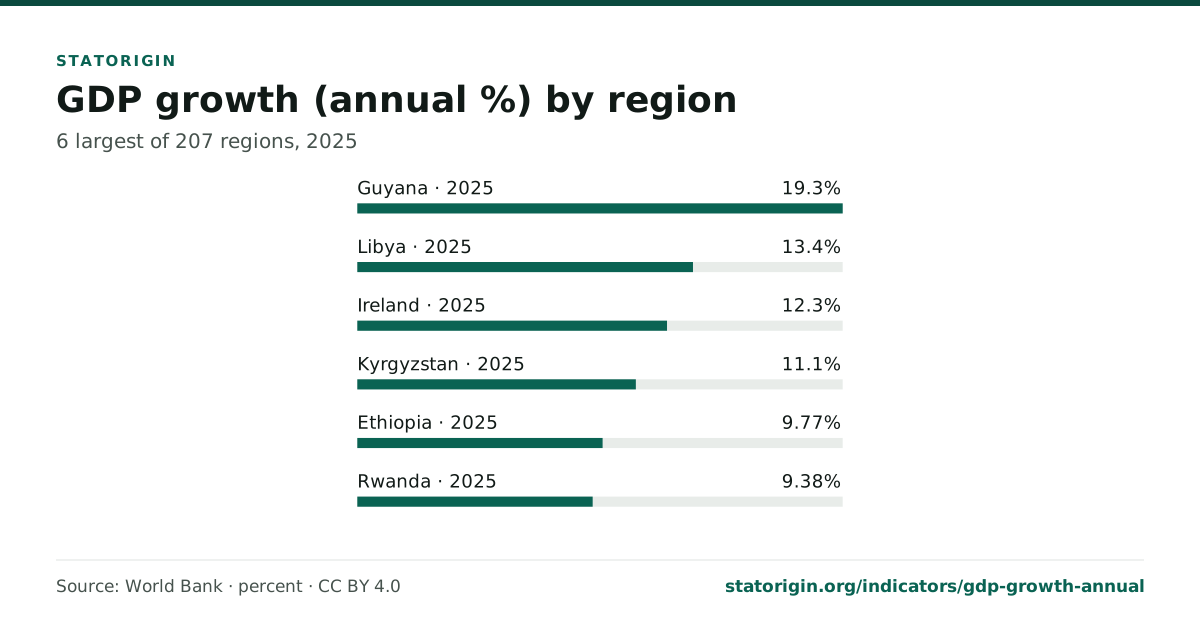
Every file carries its provenance: the CSV has a source column per row, and the chart images print the publisher, the licence and this page's address under the drawing. Source: World Bank. Licence: CC BY 4.0.
Use and publication rights
- View, cite and link: free
Quote any number, cite this page or a single record, and link to it anywhere.
- Copy, chart and republish: free with attribution
The data is published under CC BY 4.0, commercial use included. Credit StatOrigin and the original publisher (World Bank); the chart files already carry that line.
- The source documents: the publisher's terms
Figures are facts read from the publishers' own documents. The documents themselves, their text and design, stay under each publisher's terms; follow the source links for those.
How this measure is built
- Definition
- Annual percentage growth rate of real GDP at constant market prices.
- Measure
- One slice of Gross domestic product ( form: growth ) . Aggregate monetary value of all goods and services produced within an economy during an accounting period. Region and period are columns on every record, not slices.
- Limitations
- Publishers release on different schedules, so the latest period differs by region; compare regions on the same period. Values are shown as published; StatOrigin does not revise, fill gaps or convert currencies.
- Verification
- Each value, unit, period and place was checked against its source evidence before publication. See the methodology and the corrections process.
Sources · 1 document
| Document | Publisher | Published | Data points |
|---|---|---|---|
| World Bank GDP real annual growth rate | World Bank | — | 11275 |
Frequently asked questions
What is the latest GDP growth (annual %)?
Guyana had the highest GDP growth (annual %) in 2025, at 19.3%, ahead of Libya (13.4%) and Ireland (12.3%). In Guyana that is −24.5 pp on 2024.
Which country has the highest GDP growth (annual %)?
Guyana, at 19.3% in 2025. 185 countries published figures for that period.
Where does this data come from?
From 1 document published by World Bank. Every figure on this page links to its record, which quotes the sentence or table row the number was read from.
How often is it updated?
Annual. The newest published period is 2025; the next release should cover 2026. A new figure appears here once the publisher releases it and it passes verification.
Can I use this data?
Yes. StatOrigin publishes it under CC BY 4.0: you may copy, chart and republish it, including commercially, with attribution to StatOrigin and to the original publisher.
Cite this page
Cite the page as a data set, or open any record to cite one figure: each record carries APA, MLA, Chicago and BibTeX forms that credit the original publisher.
StatOrigin. (2026). GDP growth (annual %) [Data set]. Retrieved October 2, 2026, from https://statorigin.org/indicators/gdp-growth-annual
"GDP growth (annual %)." StatOrigin, 2026, https://statorigin.org/indicators/gdp-growth-annual. Accessed 2 Oct. 2026.
StatOrigin. "GDP growth (annual %)." Data set, 2026. Accessed October 2, 2026. https://statorigin.org/indicators/gdp-growth-annual.
@misc{statorigin_gdp_growth_annual_2026, title = {GDP growth (annual \%)}, author = {{StatOrigin}}, year = {2026}, url = {https://statorigin.org/indicators/gdp-growth-annual}, note = {Data set. Accessed 2026-10-02} }