TOPIC_ECONOMY · Economy · 285 regions
Regional GDP per capita in PPS
Eastern and Midland: 107,200 PPS in 2024, +11.3% on 2023.
- 107,200 PPS Latest · Eastern and Midland · 2024
- +11.3% vs 2023
- Annual Release cadence
- 2,826 Records · 285 regions · 2015–2024
Verified 3 Oct 2026 · 1 publisher · Next period 2025
By region
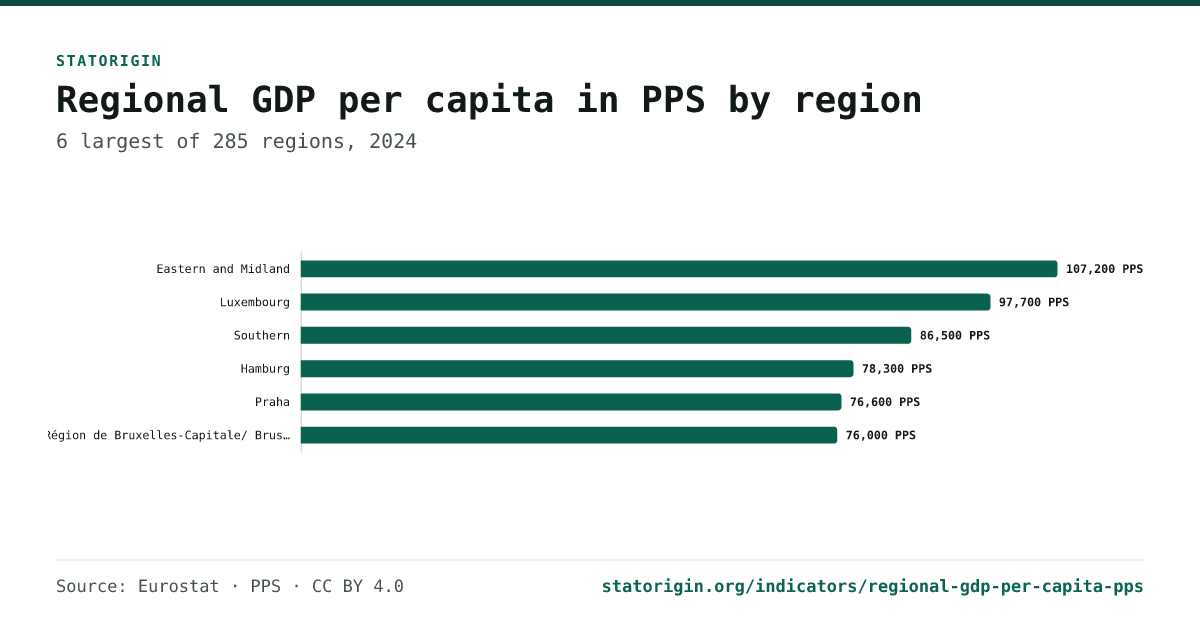
Each region's latest published value, the 6 largest of 285. Periods differ where publishers release on different schedules; the period sits under each name.
Regional GDP per capita in PPS by region
6 largest of 285 regions, 2024
View the underlying data
| Category | Source | Type | Value |
|---|---|---|---|
| Eastern and Midland | Eurostat | Actual | 107,200 PPS |
| Luxembourg | Eurostat | Actual | 97,700 PPS |
| Southern | Eurostat | Actual | 86,500 PPS |
| Hamburg | Eurostat | Actual | 78,300 PPS |
| Praha | Eurostat | Actual | 76,600 PPS |
| Région de Bruxelles-Capitale/ Brussels Hoofdstedelijk Gewest | Eurostat | Actual | 76,000 PPS |
Record preview
2,826 records · 285 regions · 2015–2024. Each period links to its record: the value, its source evidence and original document.
Showing 6 recent records from the first 6 regions in the overview. Download all 2826 records (CSV) or read a regional JSON series.
| Period | Value | Source | Type |
|---|---|---|---|
| Eastern and Midland 1 record | |||
| 2024 | 107,200 PPS | Eurostat · 31 Dec 2024 | |
| Luxembourg 1 record | |||
| 2024 | 97,700 PPS | Eurostat · 31 Dec 2024 | |
| Southern 1 record | |||
| 2024 | 86,500 PPS | Eurostat · 31 Dec 2024 | |
| Hamburg 1 record | |||
| 2024 | 78,300 PPS | Eurostat · 31 Dec 2024 | |
| Praha 1 record | |||
| 2024 | 76,600 PPS | Eurostat · 31 Dec 2024 | |
| Région de Bruxelles-Capitale/ Brussels Hoofdstedelijk Gewest 1 record | |||
| 2024 | 76,000 PPS | Eurostat · 31 Dec 2024 | |
Explore by country
Open a country for its time series and source records. Countries with fewer than three records link to their JSON series.
- Abruzzo
- Adana, Mersin
- Agder og Sør-Østlandet
- Ağrı, Kars, Iğdır, Ardahan
- Åland
- Alentejo
- Algarve
- Alsace
- Anatoliki Makedonia, Thraki
- Andalucía
- Ankara
- Antalya, Isparta, Burdur
- Aquitaine
- Aragón
- Arnsberg
- Attiki
- Autonomous Province of Vojvodina
- Auvergne
- Aydın, Denizli, Muğla
- Balıkesir, Çanakkale
- Basilicata
- Basse-Normandie
- Berlin
- Bourgogne
- Brandenburg
- Bratislavský kraj
- Braunschweig
- Bremen
- Bretagne
- Bucureşti-Ilfov
- Budapest
- Burgenland
- Bursa, Eskişehir, Bilecik
- Calabria
- Campania
- Canarias
- Cantabria
- Castilla y León
- Castilla-La Mancha
- Cataluña
- Centre — Val de Loire
- Centro (PT)
- Centru
- Champagne-Ardenne
- Chemnitz
- City of Belgrade
- Ciudad de Ceuta
- Ciudad de Melilla
- Comunidad de Madrid
- Comunidad Foral de Navarra
- Comunitat Valenciana
- Corse
- Crna Gora
- Darmstadt
- Dél-Alföld
- Dél-Dunántúl
- Detmold
- Dolnośląskie
- Drenthe
- Dresden
- Düsseldorf
- Dytiki Elláda
- Dytiki Makedonia
- Eastern and Midland
- Eesti
- Emilia-Romagna
- Erzurum, Erzincan, Bayburt
- Észak-Alföld
- Észak-Magyarország
- Etelä-Suomi
- Extremadura
- Flevoland
- Franche-Comté
- Freiburg
- Friesland (NL)
- Friuli-Venezia Giulia
- Galicia
- Gaziantep, Adıyaman, Kilis
- Gelderland
- Gießen
- Grad Zagreb
- Grande Lisboa
- Groningen
- Guadeloupe
- Guyane
- Hamburg
- Hannover
- Hatay, Kahramanmaraş, Osmaniye
- Haute-Normandie
- Helsinki-Uusimaa
- Hovedstaden
- Ile-de-France
- Illes Balears
- Innlandet
- Ionia Nisia
- Ipeiros
- İstanbul
- İzmir
- Jadranska Hrvatska
- Jihovýchod
- Jihozápad
- Jug
- Karlsruhe
- Kärnten
- Kassel
- Kastamonu, Çankırı, Sinop
- Kayseri, Sivas, Yozgat
- Kentriki Makedonia
- Kırıkkale, Aksaray, Niğde, Nevşehir, Kırşehir
- Koblenz
- Kocaeli, Sakarya, Düzce, Bolu, Yalova
- Köln
- Konya, Karaman
- Közép-Dunántúl
- Kriti
- Kujawsko-pomorskie
- Kýpros
- La Réunion
- La Rioja
- Languedoc-Roussillon
- Länsi-Suomi
- Latvija
- Lazio
- Leipzig
- Liguria
- Limburg (NL)
- Limousin
- Łódzkie
- Lombardia
- Lorraine
- Lubelskie
- Lubuskie
- Lüneburg
- Luxembourg
- Malatya, Elazığ, Bingöl, Tunceli
- Małopolskie
- Malta
- Manisa, Afyonkarahisar, Kütahya, Uşak
- Marche
- Mardin, Batman, Şırnak, Siirt
- Martinique
- Mayotte
- Mazowiecki regionalny
- Mecklenburg-Vorpommern
- Mellersta Norrland
- Midi-Pyrénées
- Midtjylland
- Mittelfranken
- Molise
- Moravskoslezsko
- Münster
- Niederbayern
- Niederösterreich
- Noord-Brabant
- Noord-Holland
- Nord-Est
- Nord-Norge
- Nord-Pas de Calais
- Nord-Vest
- Nordjylland
- Norra Mellansverige
- Norte
- Northern and Western
- Notio Aigaio
- Nyugat-Dunántúl
- Oberbayern
- Oberfranken
- Oberösterreich
- Oberpfalz
- Oeste e Vale do Tejo
- Opolskie
- Oslo og Viken
- Östra Mellansverige
- Overijssel
- Övre Norrland
- País Vasco
- Panonska Hrvatska
- Pays de la Loire
- Peloponnisos
- Península de Setúbal
- Pest
- Picardie
- Piemonte
- Podkarpackie
- Podlaskie
- Pohjois- ja Itä-Suomi
- Poitou-Charentes
- Pomorskie
- Praha
- Principado de Asturias
- Prov. Antwerpen
- Prov. Brabant wallon
- Prov. Hainaut
- Prov. Liège
- Prov. Limburg (BE)
- Prov. Luxembourg (BE)
- Prov. Namur
- Prov. Oost-Vlaanderen
- Prov. Vlaams-Brabant
- Prov. West-Vlaanderen
- Provence-Alpes-Côte d’Azur
- Provincia Autonoma di Bolzano/Bozen
- Provincia Autonoma di Trento
- Puglia
- Qender
- Região Autónoma da Madeira
- Região Autónoma dos Açores
- Région de Bruxelles-Capitale/ Brussels Hoofdstedelijk Gewest
- Región de Murcia
- Region Južne i Istočne Srbije
- Region Šumadije i Zapadne Srbije
- Rheinhessen-Pfalz
- Rhône-Alpes
- Saarland
- Sachsen-Anhalt
- Salzburg
- Samsun, Tokat, Çorum, Amasya
- Şanlıurfa, Diyarbakır
- Sardegna
- Schleswig-Holstein
- Schwaben
- Severen tsentralen
- Severna Makedonija
- Severoiztochen
- Severovýchod
- Severozápad
- Severozapaden
- Sicilia
- Sjælland
- Sjeverna Hrvatska
- Śląskie
- Småland med öarna
- Sostinės regionas
- Southern
- Steiermark
- Sterea Elláda
- Stockholm
- Stredné Slovensko
- Střední Čechy
- Střední Morava
- Stuttgart
- Sud-Est
- Sud-Muntenia
- Sud-Vest Oltenia
- Świętokrzyskie
- Syddanmark
- Sydsverige
- Tekirdağ, Edirne, Kırklareli
- Thessalia
- Thüringen
- Tirol
- Toscana
- Trabzon, Ordu, Giresun, Rize, Artvin, Gümüşhane
- Trier
- Trøndelag/Trööndelage
- Tübingen
- Umbria
- Unterfranken
- Utrecht
- Valle d’Aosta/Vallée d’Aoste
- Van, Muş, Bitlis, Hakkari
- Västsverige
- Veneto
- Veri
- Vest
- Vestlandet
- Vidurio ir vakarų Lietuvos regionas
- Vorarlberg
- Voreio Aigaio
- Východné Slovensko
- Vzhodna Slovenija
- Warmińsko-mazurskie
- Warszawski stołeczny
- Weser-Ems
- Wielkopolskie
- Wien
- Yugoiztochen
- Yugozapaden
- Yuzhen tsentralen
- Zachodniopomorskie
- Zahodna Slovenija
- Západné Slovensko
- Zeeland
- Zonguldak, Karabük, Bartın
- Zuid-Holland
Download this data
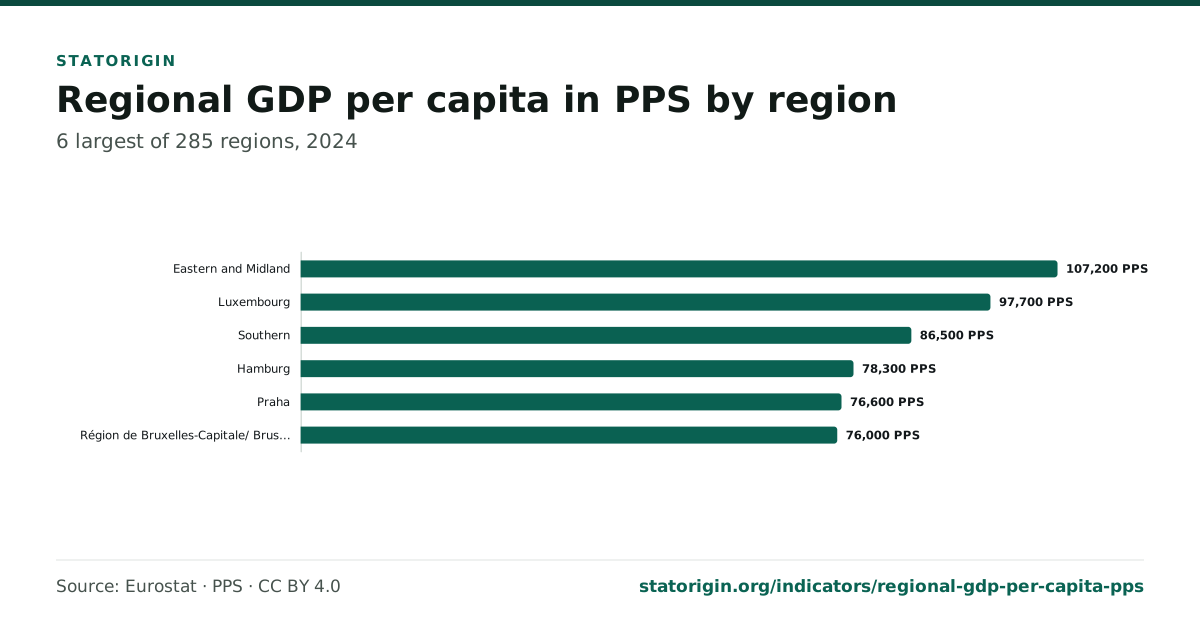
Every file carries its provenance: the CSV has a source column per row, and the chart images print the publisher, the licence and this page's address under the drawing. Source: Eurostat. Licence: CC BY 4.0.
Use and publication rights
- View, cite and link: free
Quote any number, cite this page or a single record, and link to it anywhere.
- Copy, chart and republish: free with attribution
The data is published under CC BY 4.0, commercial use included. Credit StatOrigin and the original publisher (Eurostat); the chart files already carry that line.
- The source documents: the publisher's terms
Figures are facts read from the publishers' own documents. The documents themselves, their text and design, stay under each publisher's terms; follow the source links for those.
How this measure is built
- Definition
- Gross domestic product per inhabitant in purchasing power standards (PPS, EU27 from 2020) by NUTS 2 region.
- Measure
- One slice of Gross domestic product ( basis: per capita, counting rule: pps, form: level ) . Aggregate monetary value of all goods and services produced within an economy during an accounting period. Region and period are columns on every record, not slices.
- Limitations
- Publishers release on different schedules, so the latest period differs by region; compare regions on the same period. Values are shown as published; StatOrigin does not revise, fill gaps or convert currencies.
- Verification
- Each value, unit, period and place was checked against its source evidence before publication. See the methodology and the corrections process.
Sources · 1 document
| Document | Publisher | Published | Data points |
|---|---|---|---|
| Eurostat gross domestic product (GDP) at current market prices by NUTS 2 region | Eurostat | — | 2826 |
Other slices of gross domestic product
- GDP (current US$) 11612
- GDP growth (annual %) 11275
- GDP per capita, PPP (current international $) 6985 per capita · ppp
Frequently asked questions
What is the latest regional GDP per capita in PPS?
Eastern and Midland: 107,200 PPS in 2024, +11.3% on 2023.
Where does this data come from?
From 1 document published by Eurostat. Every figure on this page links to its record, which quotes the sentence or table row the number was read from.
How often is it updated?
Annual. The newest published period is 2024; the next release should cover 2025. A new figure appears here once the publisher releases it and it passes verification.
Can I use this data?
Yes. StatOrigin publishes it under CC BY 4.0: you may copy, chart and republish it, including commercially, with attribution to StatOrigin and to the original publisher.
Cite this page
Cite the page as a data set, or open any record to cite one figure: each record carries APA, MLA, Chicago and BibTeX forms that credit the original publisher.
StatOrigin. (2026). Regional GDP per capita in PPS [Data set]. Retrieved October 14, 2026, from https://statorigin.org/indicators/regional-gdp-per-capita-pps
"Regional GDP per capita in PPS." StatOrigin, 2026, https://statorigin.org/indicators/regional-gdp-per-capita-pps. Accessed 14 Oct. 2026.
StatOrigin. "Regional GDP per capita in PPS." Data set, 2026. Accessed October 14, 2026. https://statorigin.org/indicators/regional-gdp-per-capita-pps.
@misc{statorigin_regional_gdp_per_capita_pps_2026, title = {Regional GDP per capita in PPS}, author = {{StatOrigin}}, year = {2026}, url = {https://statorigin.org/indicators/regional-gdp-per-capita-pps}, note = {Data set. Accessed 2026-10-14} }