C10 · Food and Beverage · 5 measures · 3 regions
Food consumption
Latin America and the Caribbean: 25.4 kg/person/year in 2023–2025. OECD projects 25.2 kg/person/year for 2035.
- 25.4 kg/person/year Rice per capita food consumption · Latin America and the Caribbean · 2023–2025
- 5Measures
- 0Countries · 2023–2025
Verified 27 Sep 2026 · 2 publishers · 11 records
Rice per capita food consumption
The best-covered measure of food consumption. Every point opens its record; the values are one click away under the chart.
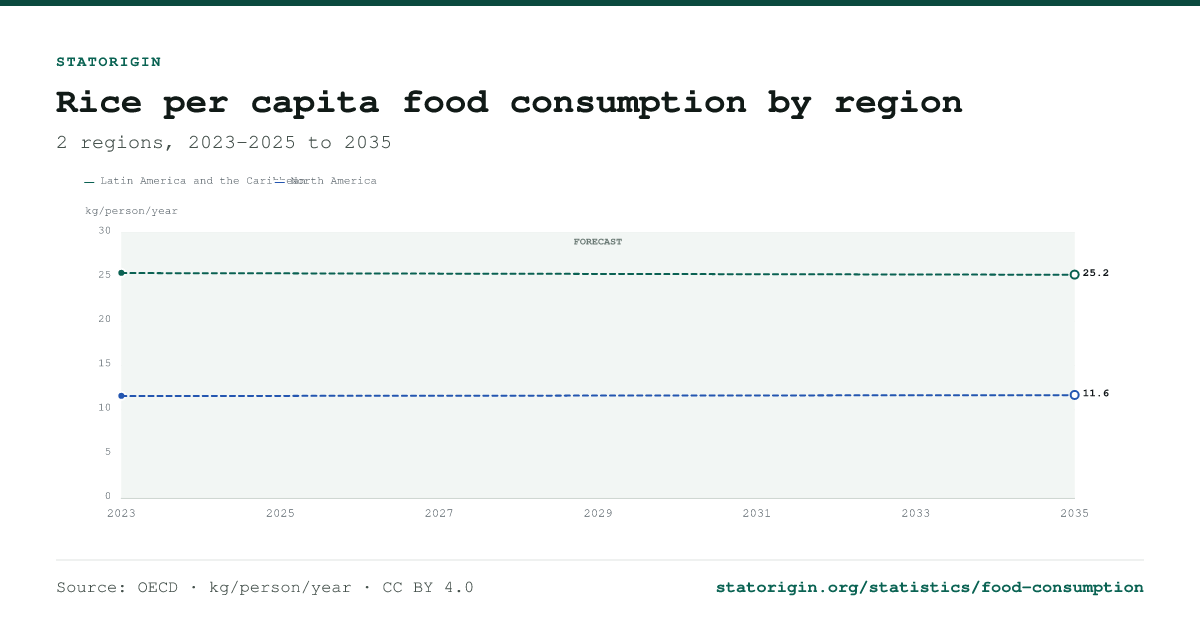
Rice per capita food consumption by region
2 regions, 2023–2025 to 2035
Forecast: dashed line, hollow markers, shaded band Estimates are listed as such in the table below
View the underlying data
| Region | Period | Type | Value |
|---|---|---|---|
| Latin America and the Caribbean | 2035 | Forecast | 25.2 kg/person/year |
| Latin America and the Caribbean | 2023–2025 | Estimate | 25.4 kg/person/year |
| North America | 2035 | Forecast | 11.6 kg/person/year |
| North America | 2023–2025 | Estimate | 11.5 kg/person/year |
Forecasts are dashed, with hollow markers.
Rice per capita food consumption by region
Latest value per region, 2023–2025
Estimate
View the underlying data
| Category | Source | Type | Value |
|---|---|---|---|
| Latin America and the Caribbean | OECD | Estimate | 25.4 kg/person/year |
| North America | OECD | Estimate | 11.5 kg/person/year |
Every measure of food consumption
5 measures: the same subject cut by product, segment, basis or form. Each has its own page with every record.
| Measure | Latest | Where and when | Records |
|---|---|---|---|
| Rice per capita food consumption | 25.4 kg/person/year | Latin America and the Caribbean, 2023–2025 | 4 |
| Sugar consumption | 180.4 million tonnes | Global, 2026–2027 (forecast) | 3 |
| Rice per capita food consumption growth rate | -0.2% | Latin America and the Caribbean, 2026–2035 (forecast) | 2 |
| Cereal consumption | 3.25 billion tonnes | Global, 2035 (forecast) | 1 |
| Cereal consumption growth rate | 12% | Global, 2035 (forecast) | 1 |
Frequently asked questions
What does food consumption measure?
Physical volume of a product or product group consumed in a given period.
What is the latest rice per capita food consumption?
Latin America and the Caribbean: 25.4 kg/person/year in 2023–2025. OECD projects 25.2 kg/person/year for 2035.
Which countries does this food consumption data cover?
Worldwide and regional totals only; no single-country figures are published yet.
Where does the data come from?
From 3 documents published by OECD and ISO. Every figure links to its record, which quotes the sentence or table row it was read from.
How often is it updated?
Annual; the newest figure covers 2023–2025.
Sources
3 documents from 2 publishers. Each links to the publisher's own copy.
| Document | Publisher | Published | Data points |
|---|---|---|---|
| International Sugar Organization | ISO | — | 2 |
| International Sugar Organization | ISO | — | 1 |
| Cereals: OECD-FAO Agricultural Outlook 2026-2035 | OECD | — | 8 |
Cite this page
Published under CC BY 4.0: free to reuse, including commercially, with attribution to StatOrigin and the original publisher. To cite one figure, open its record.
StatOrigin. (2026). Food consumption statistics [Data set]. Retrieved September 29, 2026, from https://statorigin.org/statistics/food-consumption
"Food consumption statistics." StatOrigin, 2026, https://statorigin.org/statistics/food-consumption. Accessed 29 Sep. 2026.
StatOrigin. "Food consumption statistics." Data set, 2026. Accessed September 29, 2026. https://statorigin.org/statistics/food-consumption.
@misc{statorigin_food_consumption_2026, title = {Food consumption statistics}, author = {{StatOrigin}}, year = {2026}, url = {https://statorigin.org/statistics/food-consumption}, note = {Data set. Accessed 2026-09-29} }