K64 · Banking · 4 measures · 1 region
Money supply
Euro area: 3.4% in July 2026, +0.0 pp on July 2025.
- 3.4% Broad monetary aggregate M3 annual growth rate · Euro area · July 2026
- +0.0 pp vs July 2025
- 4Measures
- 0Countries · 2024–2026
Verified 27 Sep 2026 · 1 publisher · 64 records · Next period August 2026
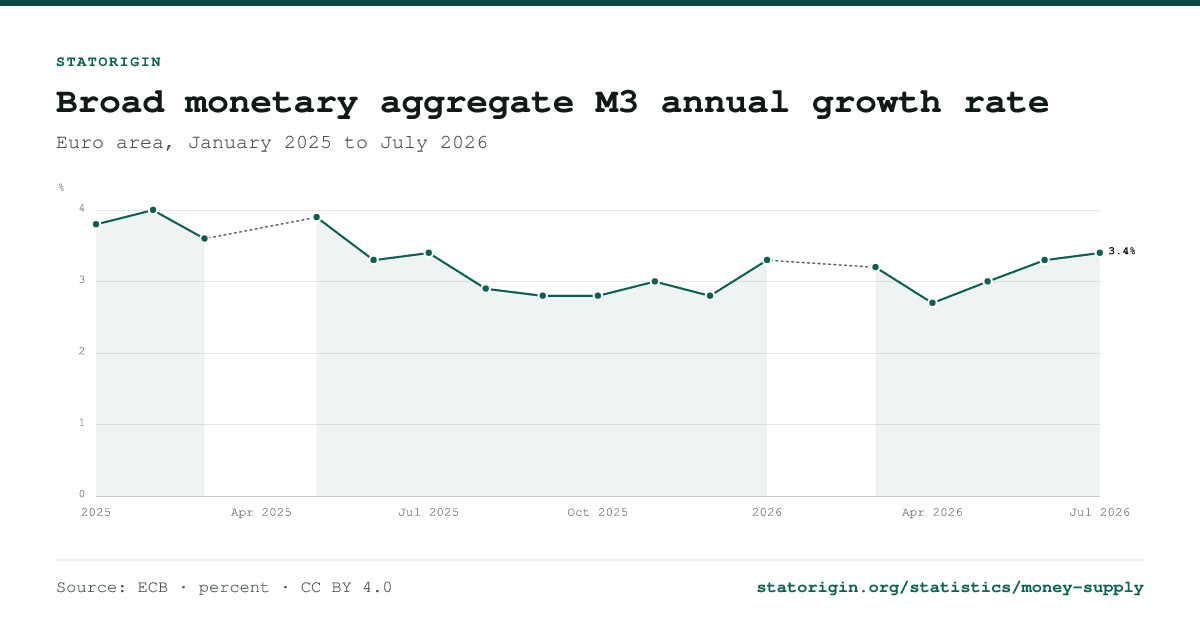
Broad monetary aggregate M3 annual growth rate
The best-covered measure of money supply. Every point opens its record; the values are one click away under the chart.
Broad monetary aggregate M3 annual growth rate
Euro area, January 2025 to July 2026
No figure published for these periods
View the underlying data
| Period | Type | Value |
|---|---|---|
| January 2025 | Actual | 3.8% |
| February 2025 | Actual | 4% |
| March 2025 | Actual | 3.6% |
| May 2025 | Actual | 3.9% |
| June 2025 | Actual | 3.3% |
| July 2025 | Actual | 3.4% |
| August 2025 | Actual | 2.9% |
| September 2025 | Actual | 2.8% |
| October 2025 | Actual | 2.8% |
| November 2025 | Actual | 3% |
| December 2025 | Actual | 2.8% |
| January 2026 | Actual | 3.3% |
| March 2026 | Actual | 3.2% |
| April 2026 | Actual | 2.7% |
| May 2026 | Actual | 3% |
| June 2026 | Actual | 3.3% |
| July 2026 | Actual | 3.4% |
Every measure of money supply
4 measures: the same subject cut by product, segment, basis or form. Each has its own page with every record.
| Measure | Latest | Where and when | Records |
|---|---|---|---|
| Broad monetary aggregate M3 annual growth rate | 3.4% | Euro area, July 2026 | 19 |
| Narrow monetary aggregate M1 annual growth rate | 3.1% | Euro area, July 2026 | 17 |
| Broad monetary aggregate M3 three-month average annual growth rate | 3.2% | Euro area, May–July 2026 | 14 |
| Marketable instruments annual growth rate | 4.2% | Euro area, July 2026 | 14 |
Frequently asked questions
What does money supply measure?
The total amount of monetary assets available in an economy at a specific time.
What is the latest broad monetary aggregate M3 annual growth rate?
Euro area: 3.4% in July 2026, +0.0 pp on July 2025.
Which countries does this money supply data cover?
Worldwide and regional totals only; no single-country figures are published yet.
Where does the data come from?
From 14 documents published by ECB. Every figure links to its record, which quotes the sentence or table row it was read from.
How often is it updated?
Monthly; the newest figure covers July 2026, and the next release should cover August 2026.
Sources
14 documents from 1 publisher. Each links to the publisher's own copy.
Cite this page
Published under CC BY 4.0: free to reuse, including commercially, with attribution to StatOrigin and the original publisher. To cite one figure, open its record.
StatOrigin. (2026). Money supply statistics [Data set]. Retrieved September 29, 2026, from https://statorigin.org/statistics/money-supply
"Money supply statistics." StatOrigin, 2026, https://statorigin.org/statistics/money-supply. Accessed 29 Sep. 2026.
StatOrigin. "Money supply statistics." Data set, 2026. Accessed September 29, 2026. https://statorigin.org/statistics/money-supply.
@misc{statorigin_money_supply_2026, title = {Money supply statistics}, author = {{StatOrigin}}, year = {2026}, url = {https://statorigin.org/statistics/money-supply}, note = {Data set. Accessed 2026-09-29} }