Ranking · 191 countries · 2024

Carbon intensity of electricity by country (2024)

Turkmenistan had the highest carbon intensity of electricity in 2024, at 1,306.3 gCO2e/kWh, followed by Uzbekistan (1,040.1 gCO2e/kWh) and Kosovo (924.4 gCO2e/kWh). The ranking compares 191 countries on 2024 figures from Ember. Ethiopia ranked last of the 191, at 23.4 gCO2e/kWh.

JSON Cite and reuse

5,090 verified figures Updated 4 Oct 2026 Sources typically refresh annually

How this ranking is built. Indicator: Carbon intensity of electricity generation · Topic: Carbon intensity of electricity · Industry: Electricity and Gas Utilities · Period: 2024. Only verified actual figures and estimates for that one period are ranked, so every row is comparable; forecasts are not ranked, and world or regional totals are shown as reference, not ranked. Countries are ranked highest carbon intensity first, so the cleanest grids appear at the bottom. Every row uses the same calendar year so ranks are comparable; a later year published for some countries is left out of the rank rather than mixed into the table. Ember reports gCO2/kWh; this series is stored as gCO2e/kWh. Only Ember’s yearly electricity data is ranked: the IEA publishes a different global figure for the same indicator and is not mixed into the table. 10 other countries have data only for other periods and are omitted.

Visualised

Ranked chart

Carbon intensity of electricity generation by country

2024 · 12 highest of 191 countries

Estimates are included; each record's type is listed below.

Carbon intensity of electricity generation by countrySelected latest values by region. Periods are labelled individually. Bars start at zero; source records and value types are in the table below.Turkmenistan · 20241,306.3 gCO2e/kWhUzbekistan · 20241,040.1 gCO2e/kWhKosovo · 2024924.4 gCO2e/kWhBahrain · 2024902.2 gCO2e/kWhBrunei · 2024892.1 gCO2e/kWhBotswana · 2024851.3 gCO2e/kWhLibya · 2024826.8 gCO2e/kWhMongolia · 2024817.5 gCO2e/kWhKazakhstan · 2024801.9 gCO2e/kWhSouth Africa · 2024717.7 gCO2e/kWhCongo · 2024716.1 gCO2e/kWhIndia · 2024706.7 gCO2e/kWh
View the underlying data
Carbon intensity of electricity generation by country
RegionPeriodSourceTypeValue
Turkmenistan2024EmberEstimate1,306.3 gCO2e/kWh
Uzbekistan2024EmberEstimate1,040.1 gCO2e/kWh
Kosovo2024EmberEstimate924.4 gCO2e/kWh
Bahrain2024EmberEstimate902.2 gCO2e/kWh
Brunei2024EmberEstimate892.1 gCO2e/kWh
Botswana2024EmberEstimate851.3 gCO2e/kWh
Libya2024EmberEstimate826.8 gCO2e/kWh
Mongolia2024EmberEstimate817.5 gCO2e/kWh
Kazakhstan2024EmberEstimate801.9 gCO2e/kWh
South Africa2024EmberEstimate717.7 gCO2e/kWh
Congo2024EmberEstimate716.1 gCO2e/kWh
India2024EmberEstimate706.7 gCO2e/kWh
Source: Ember · gCO2e/kWh · CC BY 4.0 · statorigin.org

World map

2024 · gCO2e/kWh. Grey means no observation on this map. Small territories remain in the table.
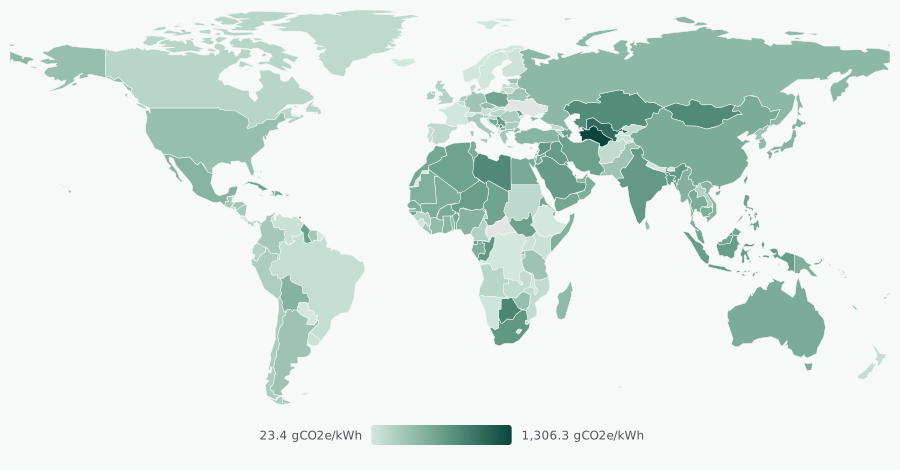
Carbon intensity of electricity by country, 2024. Full values and sources are in the country ranking table.

Sources: the same published records as the ranking. Geometry: Natural Earth, public domain. Download SVG.

The table

Country ranking

Rank · country · value · change on the same period a year earlier · source. Values in gCO2e/kWh.

Ranks 1–50 of 191 countries. Page 1 of 4.

# Country Value YoY Period Source
1 Turkmenistan TM 1,306.3 gCO2e/kWh estimate +0.0% 2024 Ember
2 Uzbekistan UZ 1,040.1 gCO2e/kWh estimate -6.6% 2024 Ember
3 Kosovo XK 924.4 gCO2e/kWh estimate +4.5% 2024 Ember
4 Bahrain BH 902.2 gCO2e/kWh estimate -0.0% 2024 Ember
5 Brunei BN 892.1 gCO2e/kWh estimate -0.3% 2024 Ember
6 Botswana BW 851.3 gCO2e/kWh estimate -0.4% 2024 Ember
7 Libya LY 826.8 gCO2e/kWh estimate +0.2% 2024 Ember
8 Mongolia MN 817.5 gCO2e/kWh estimate +0.1% 2024 Ember
9 Kazakhstan KZ 801.9 gCO2e/kWh estimate -3.0% 2024 Ember
10 South Africa ZA 717.7 gCO2e/kWh estimate +0.5% 2024 Ember
11 Congo CG 716.1 gCO2e/kWh estimate +3.5% 2024 Ember
12 India IN 706.7 gCO2e/kWh estimate -1.0% 2024 Ember
13 Syria SY 706.2 gCO2e/kWh estimate +0.1% 2024 Ember
14 Bangladesh BD 695.9 gCO2e/kWh estimate +1.9% 2024 Ember
15 Saudi Arabia SA 692 gCO2e/kWh estimate -0.8% 2024 Ember
16 Iraq IQ 683.1 gCO2e/kWh estimate -0.3% 2024 Ember
17 Trinidad and Tobago TT 681.7 gCO2e/kWh estimate -0.0% 2024 Ember
18 Indonesia ID 681.1 gCO2e/kWh estimate +0.0% 2024 Ember
19 Hong Kong, China HK 675.5 gCO2e/kWh estimate +0.2% 2024 Ember
20 Niger NE 673.7 gCO2e/kWh estimate -1.0% 2024 Ember
21 Serbia RS 668 gCO2e/kWh estimate +4.5% 2024 Ember
22 Gambia GM 666.7 gCO2e/kWh estimate +0.0% 2024 Ember
23 Grenada GD 666.7 gCO2e/kWh estimate +0.0% 2024 Ember
24 Timor-Leste TL 666.7 gCO2e/kWh estimate +0.0% 2024 Ember
25 Puerto Rico (US) PR 656.5 gCO2e/kWh estimate -0.7% 2024 Ember
26 Bahamas BS 653.3 gCO2e/kWh estimate +0.3% 2024 Ember
27 Saint Lucia LC 650 gCO2e/kWh estimate +0.0% 2024 Ember
28 Iran IR 648.7 gCO2e/kWh estimate +1.1% 2024 Ember
29 Guyana GY 644.9 gCO2e/kWh estimate +0.0% 2024 Ember
30 Equatorial Guinea GQ 644.3 gCO2e/kWh estimate -3.0% 2024 Ember
31 South Sudan SS 642.9 gCO2e/kWh estimate +0.0% 2024 Ember
32 Cuba CU 642.8 gCO2e/kWh estimate -0.2% 2024 Ember
33 Mauritius MU 642.2 gCO2e/kWh estimate +1.5% 2024 Ember
34 Bermuda BM 639.3 gCO2e/kWh estimate -0.2% 2024 Ember
35 Solomon Islands SB 636.4 gCO2e/kWh estimate +0.0% 2024 Ember
36 Taiwan, China TW 636.2 gCO2e/kWh estimate -1.4% 2024 Ember
37 Kuwait KW 635.2 gCO2e/kWh estimate -0.1% 2024 Ember
38 Azerbaijan AZ 634.3 gCO2e/kWh estimate -5.3% 2024 Ember
39 Moldova MD 634.3 gCO2e/kWh estimate -1.3% 2024 Ember
40 Cayman Islands KY 633.8 gCO2e/kWh estimate -1.4% 2024 Ember
41 Algeria DZ 632.9 gCO2e/kWh estimate -0.1% 2024 Ember
42 Philippines PH 629.5 gCO2e/kWh estimate +1.1% 2024 Ember
43 Guinea-Bissau GW 625 gCO2e/kWh estimate +0.0% 2024 Ember
44 Chad TD 621.6 gCO2e/kWh estimate +1.7% 2024 Ember
45 Maldives MV 611.8 gCO2e/kWh estimate +0.0% 2024 Ember
46 Saint Kitts and Nevis KN 608.7 gCO2e/kWh estimate -4.3% 2024 Ember
47 Poland PL 608.4 gCO2e/kWh estimate -6.5% 2024 Ember
48 Guam GU 607.5 gCO2e/kWh estimate -0.6% 2024 Ember
49 Bosnia and Herzegovina BA 602.5 gCO2e/kWh estimate +4.5% 2024 Ember
50 Malaysia MY 601.7 gCO2e/kWh estimate -1.2% 2024 Ember

Frequently asked questions

Which country has the highest carbon intensity of electricity?

Turkmenistan, at 1,306.3 gCO2e/kWh in 2024, ahead of Uzbekistan (1,040.1 gCO2e/kWh) and Kosovo (924.4 gCO2e/kWh), among 191 countries ranked on 2024 figures from Ember.

Which country has the lowest carbon intensity of electricity?

Ethiopia, at 23.4 gCO2e/kWh in 2024, then Bhutan (23.6 gCO2e/kWh).

What does this ranking measure?

Emissions intensity of electricity generation, measured as greenhouse gas emissions in carbon dioxide equivalent (gCO2e) per kilowatt-hour of electricity generated.

Which countries are included?

191 countries with 2024 figures: Turkmenistan, Uzbekistan, Kosovo, Bahrain, Brunei, Botswana, Libya, Mongolia, Kazakhstan, South Africa, Congo and India and 179 more. 10 other countries published figures only for other periods and are left out, so every row compares the same period.

Where does the data come from?

From Ember. Every value links to its record, which quotes the table or sentence it was read from. Actual figures and published estimates are ranked; forecasts are left out.

Cite & reuse

Cite this ranking

Published under CC BY 4.0.

StatOrigin. (2026). Carbon intensity of electricity by country, 2024. Retrieved from https://statorigin.org/rankings/carbon-intensity-of-electricity-by-country