G47 · Retail · 10 measures · 3 regions
E-commerce sales
United Kingdom: 28.8% in August 2026, +0.4 pp on July 2026.
- 28.8% E-commerce share of total retail sales · United Kingdom · August 2026
- +0.4 pp vs July 2026
- 10Measures
- 3Countries · 2026–2026
Verified 27 Sep 2026 · 3 publishers · 12 records · Next period September 2026
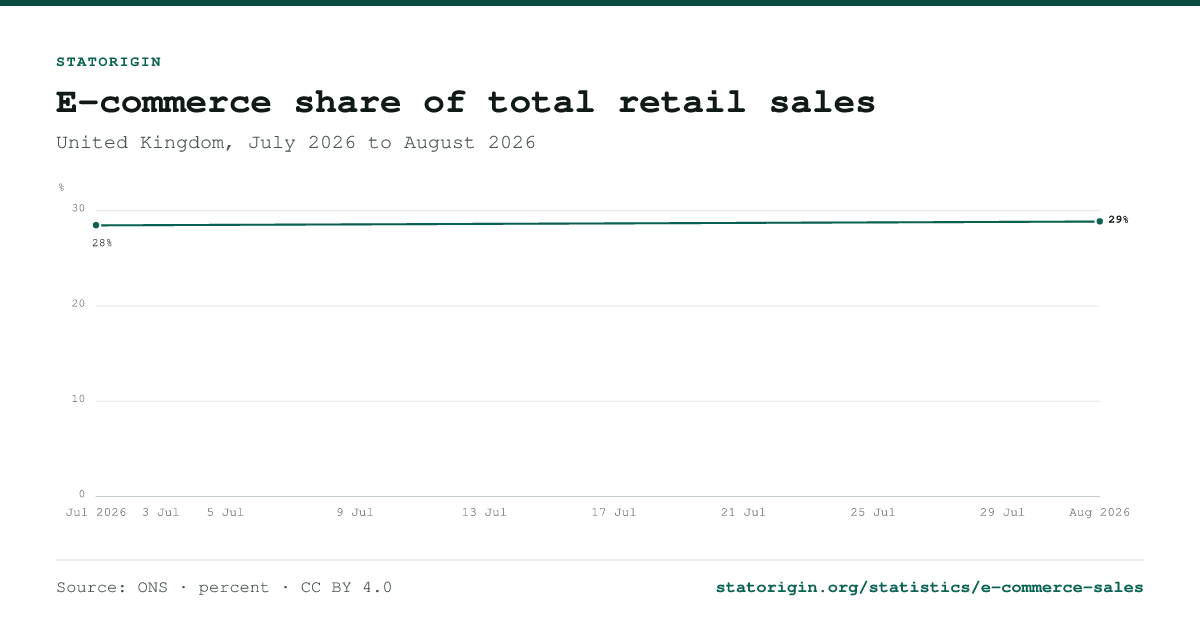
E-commerce share of total retail sales
The best-covered measure of e-commerce sales. Every point opens its record; the values are one click away under the chart.
Every measure of e-commerce sales
10 measures: the same subject cut by product, segment, basis or form. Each has its own page with every record.
| Measure | Latest | Where and when | Records |
|---|---|---|---|
| E-commerce share of total retail sales | 28.8% | United Kingdom, August 2026 | 2 |
| Food and personal care online turnover growth rate | 5% | Netherlands, July 2026 | 2 |
| E-commerce share of total retail sales (not seasonally adjusted) | 16.4% | United States, Q2 2026 | 1 |
| E-commerce share of total retail sales (seasonally adjusted) | 17.1% | United States, Q2 2026 | 1 |
| Retail e-commerce sales (quarterly, not seasonally adjusted) | 329.5 billion USD | United States, Q2 2026 | 1 |
| Retail e-commerce sales (quarterly, seasonally adjusted) | 340.2 billion USD | United States, Q2 2026 | 1 |
| Retail e-commerce sales growth quarter-over-quarter (not seasonally adjusted) | 9.4% | United States, Q2 2026 | 1 |
| Retail e-commerce sales growth quarter-over-quarter (seasonally adjusted) | 3.8% | United States, Q2 2026 | 1 |
| Retail e-commerce sales growth year-over-year (not seasonally adjusted) | 12.4% | United States, Q2 2026 | 1 |
| Retail e-commerce sales growth year-over-year (seasonally adjusted) | 12.2% | United States, Q2 2026 | 1 |
E-commerce sales by country
A page for every country with at least three records:
Frequently asked questions
What does e-commerce sales measure?
Total monetary value of sales transactions conducted electronically.
What is the latest e-commerce share of total retail sales?
United Kingdom: 28.8% in August 2026, +0.4 pp on July 2026.
Which countries does this e-commerce sales data cover?
3 countries, with a page each for United States.
Where does the data come from?
From 3 documents published by ONS, Census Bureau, CBS. Every figure links to its record, which quotes the sentence or table row it was read from.
How often is it updated?
Quarterly; the newest figure covers August 2026, and the next release should cover September 2026.
Sources
3 documents from 3 publishers. Each links to the publisher's own copy.
| Document | Publisher | Published | Data points |
|---|---|---|---|
| Retail sales, Great Britain | ONS | — | 2 |
| Retail turnover up by nearly 3 percent in July | CBS | — | 2 |
| Monthly Retail Trade - Quarterly Retail E-Commerce Sales Report | Census Bureau | — | 8 |
Cite this page
Published under CC BY 4.0: free to reuse, including commercially, with attribution to StatOrigin and the original publisher. To cite one figure, open its record.
StatOrigin. (2026). E-commerce sales statistics [Data set]. Retrieved September 29, 2026, from https://statorigin.org/statistics/e-commerce-sales
"E-commerce sales statistics." StatOrigin, 2026, https://statorigin.org/statistics/e-commerce-sales. Accessed 29 Sep. 2026.
StatOrigin. "E-commerce sales statistics." Data set, 2026. Accessed September 29, 2026. https://statorigin.org/statistics/e-commerce-sales.
@misc{statorigin_e_commerce_sales_2026, title = {E-commerce sales statistics}, author = {{StatOrigin}}, year = {2026}, url = {https://statorigin.org/statistics/e-commerce-sales}, note = {Data set. Accessed 2026-09-29} }